- EUR/USD has breached the support level at 1.05500, and selling momentum has strengthened the current downtrend in the chart.
- The Federal Reserve (Fed) has emphasized slowing down the pace of interest rate cuts, a move that could be crucial in maintaining the strength of the U.S. dollar over the long term.
EUR/USD has recorded a 2% decline over the last five sessions, favoring the dollar and placing the euro in a sustained bearish zone. This selling pressure has intensified following the Fed’s recent decision, accompanied by neutral remarks regarding decisions for the upcoming year. This bearish pressure has pushed the price to break the crucial two-year support level at 1.0550.
Fed’s Remarks
In its final meeting of the year, the Fed reduced interest rates to a range of 4.25%-4.5%, down from the previous 4.5%-4.75% (a 25-basis-point cut). This adjustment aligns with efforts to stimulate the U.S. economy in early 2025.
However, Fed Chair Jerome Powell highlighted that although inflation has decreased significantly, it remains at elevated levels, making it challenging to achieve the central bank’s 2% target. Powell also stressed the need to proceed cautiously in future decisions,given that current projections place inflation at 2.5% for 2025, still far from the central bank’s target for the upcoming year.
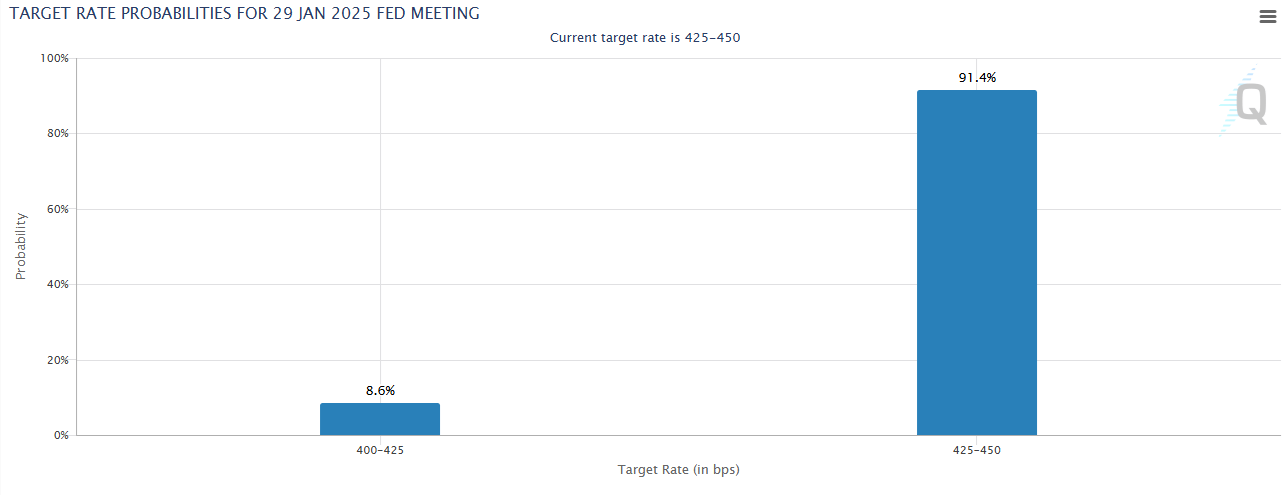
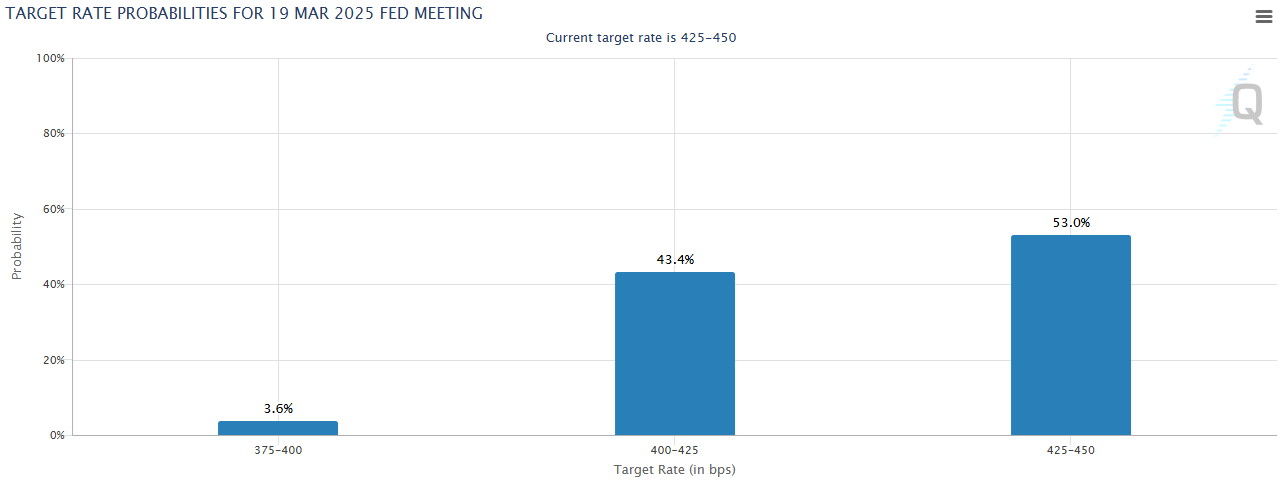
In this context, the CME Group’s probability tool currently reflects a 91% chance that the Fed will keep rates unchanged at its next meeting, scheduled for January 29. And, for the 19-march decision, the probability stands in 53% of rates unchanged versus 43% of rate reduction. That said, now the market is seeing a neutral decision bias for next decisions which could help maintain higher interest rates, leading to a stronger dollar perspective. Remember that these probabilities could shift based on economic developments leading up to that date.
Interest Rate Probability Chart January - CME Group

Source: CmeGroup
Interest Rate Probability Chart March - CME Group

Source: CmeGroup
Given the context outlined, the Fed’s interest rate of 4.5% remains significantly higher than the European Central Bank (ECB) rate of 3.15%. This differential could continue to attract investment into U.S. fixed-income assets, increasing demand for the dollar and exerting selling pressure on the EUR/USD. This scenario will likely persist as long as the U.S. central bank maintains rates above 4%.
EUR/USD Technical Forecast
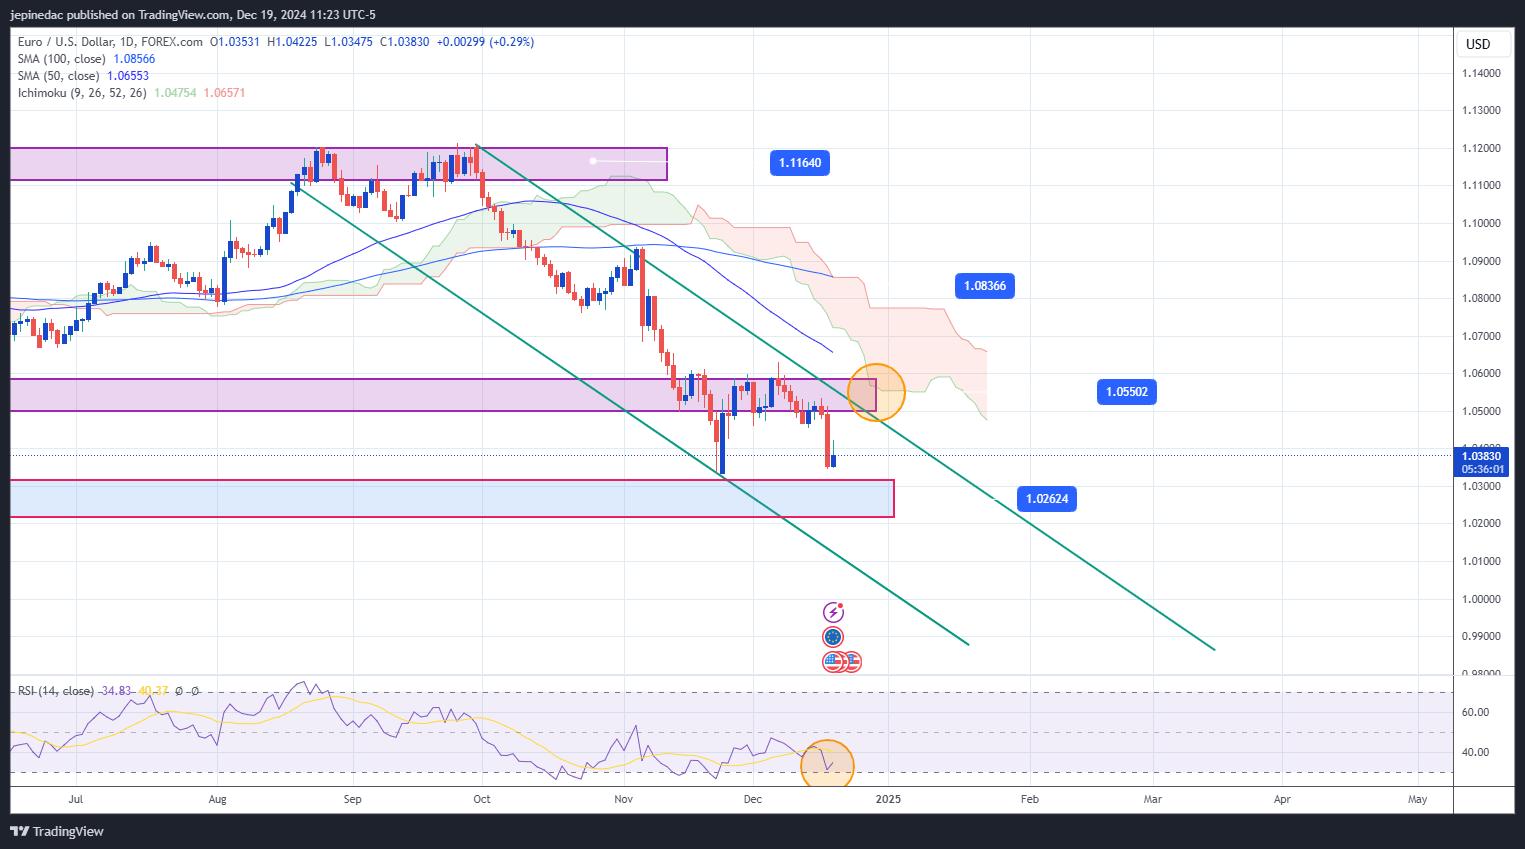
EUR/USD has maintained a steady downtrend since late September, reaching a minimum price in the 1.03 range. Recent U.S. monetary policy events have strengthened the dollar, once again driving the price close to these lows not seen since November.

Source: StoneX, Tradingview
- Downtrend Channel: The current downtrend channel favoring the dollar remains intact, with no significant bullish breakout threatening the formation. However, it’s important to note that the recent low at 1.03 remains a relevant support level that could trigger bullish corrections as the channel evolves. This level also represents the last low within the downtrend channel, and further lower lows are required to avoid a lateral consolidation in the short term.
- RSI: The RSI indicator remains below 50, signaling that bearish momentum dominates the market in the short term. However, the RSI line is near an oversold zone, around the 20 level, which could indicate potential exhaustion of the bearish momentum and open the door for bullish corrections near the closest support level (1.03).
Key Levels:
- 1.03: The current support level corresponds to areas of indecision that served as a barrier in 2023. A drop below this level could lead to new lows in the current downtrend and reinforce the bearish bias.
- 1.05500: This is the new resistance zone, coinciding with the lower boundary of the lateral range maintained during 2024. It also converges with the upper line of the downtrend channel and the Ichimoku cloud, further reinforcing its importance as a barrier. Movements above this level could weaken the current downtrend and threaten the channel formation.


