EUR/AUD technical analysis
Last week I noted some symmetrical qualities of price action EUR/AUD. On the bullish side of the equation was a strong rally which began with a false break of the June and October lows, before printing a bullish flag and sustained move. Last week I noted the inverse appeared to be playing out, with a sudden momentum shift at resistance and potential bear flag. A breakout of which has since occurred.

- A bearish engulfing candle formed on Monday to confirm a bear-flag breakout
- A 61.8% projection lands near the December VPOC (volume point of control) and Jan 2 low, making it a viable target for bears
- A 100% projection (bear-flag target) lands near the 200-day SMA and November VAH (value area high), which is also an area of interest for bears
Wall Street futures (S&P 500, Dow Jones, Nasdaq 100)
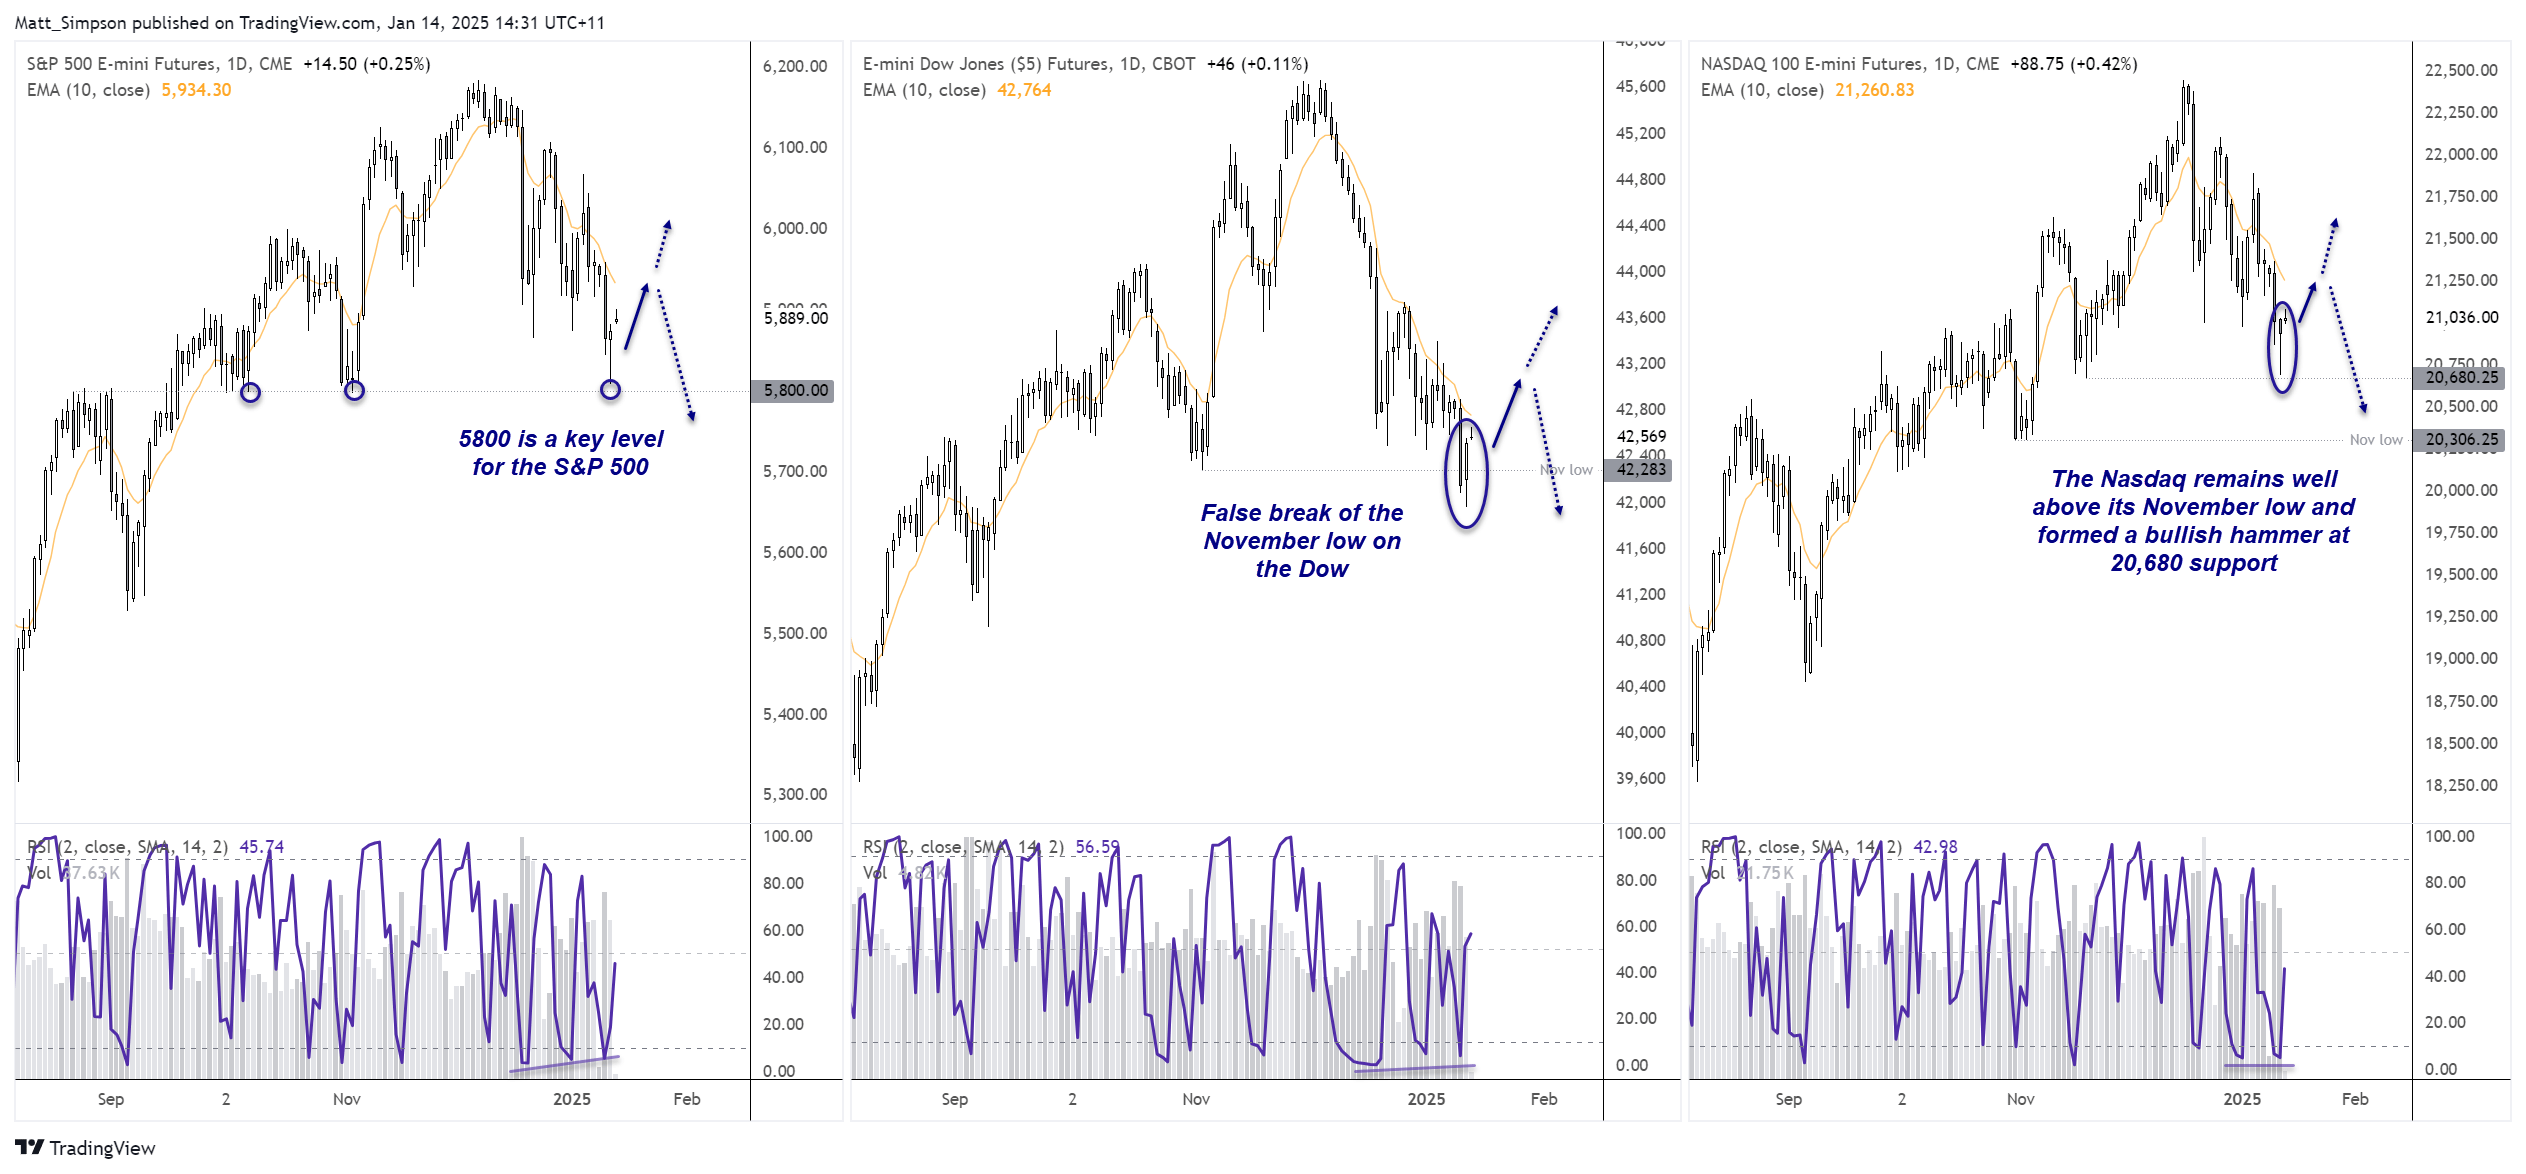
It was anything but Santa’s rally in December, with its end-of-month gains failing to impress considering its losses earlier in the month. And January hasn’t fared too well either so far, with traders struggling to lift the bid while we all await President Trump’s return. However, they are holding above levels of support which could prompt a sympathy-bounce, and in turn help the ASX recover from recent losses.

- 5800 has been a strong level of support for the S&P 500, and Monday’s bullish pinbar held above this key level without testing it to show demand around this key level
- A 2-bar bullish reversal (bullish piercing pattern) closed back above the November low on the Dow Jones, suggesting a bear trap could be in motion
- The Nasdaq 100 remains elevated above its November low, and Monday’s bullish pinbar is holding above 20,680 support for now
- Bullish divergences have also formed on all three indices on the daily RSI (2)
ASX 200 futures (SPI 200) technical analysis
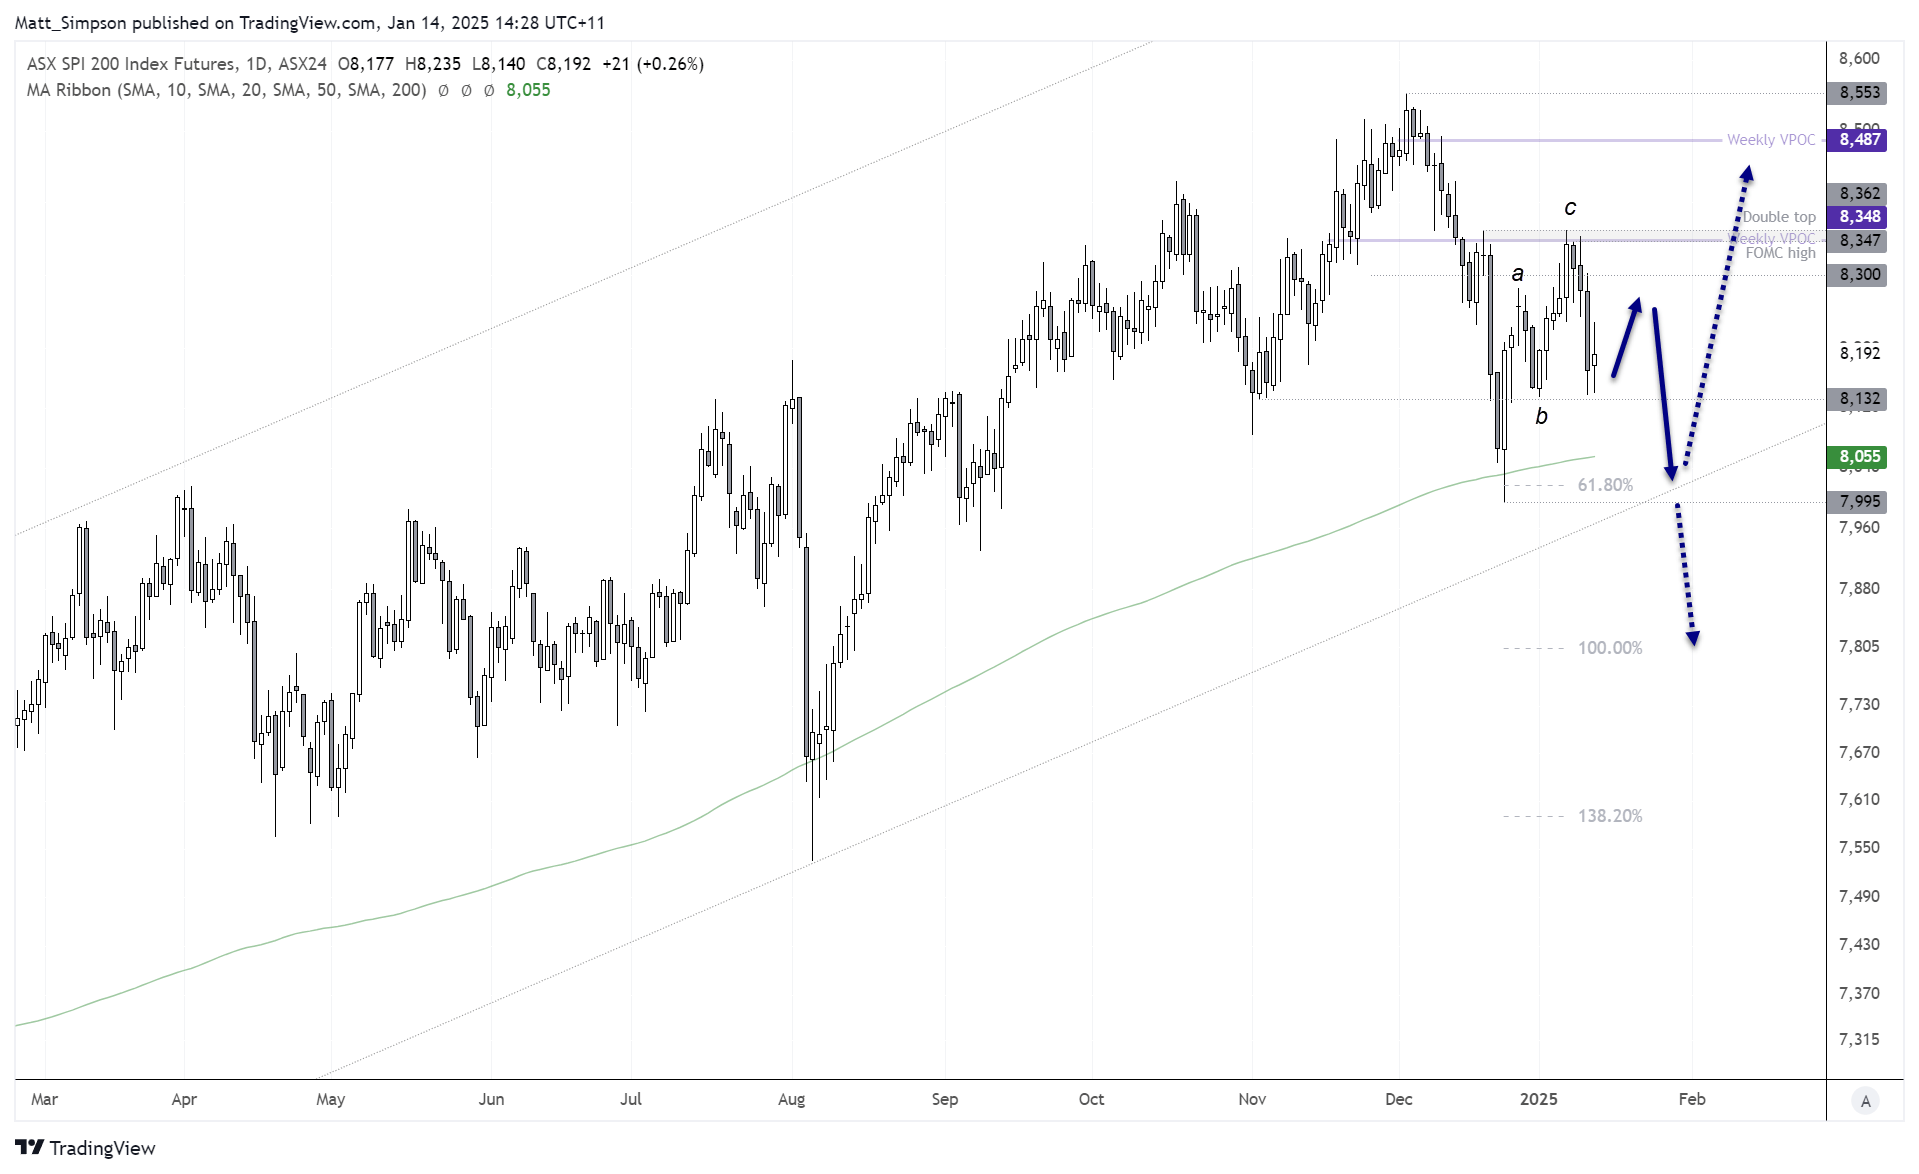
Losses from the December high were direct, providing only a 2-day sympathy-bounce along the way. This made me suspicious of the gains seen earlier in January, and placed me on guard for another leg lower. And that leg appears to have begun.
The 5-day rally which terminated last week failed to take out the 18 December high, leaving a double top at 8632. Also note that the ASX failed to print a daily close above the weekly VPOC (volume point of control) or FOMC high. The fact these clues were then followed up with 3-bearish days totalling a decline of -2.7% adds weigh to the argument that a 3-wave correction is now complete. If so, it also implies an eventual break beneath the 7995 low set on 24 December.
Still, we should be on guard for a mini bounce from 8132 support, given how Wall Street is trading around key support levels.

- Bears could therefore seek to fade into any such bounce while prices hold below 8300, and await evidence of a swing high on the daily chart
- A break below 8130 brings the 200-day SMA into focus (8055) near a 61.8% Fibonacci projection
- 7995 and 8000 makes a likely support zone near the lower trendline, a break beneath which assumes a larger risk-off environment
-- Written by Matt Simpson
Follow Matt on Twitter @cLeverEdge


