Today, after market, Hewlett Packard Enterprise (HPE) is expected to report fourth quarter EPS of $0.35 compared to $0.49 last year on revenue of approximately $6.9 billion vs. $7.2 billion a year earlier. The company is a supplier of information technology products and services, and its expected move based on front-month options is 6.0%. The last time the company reported earnings the stock rose 3.6%.
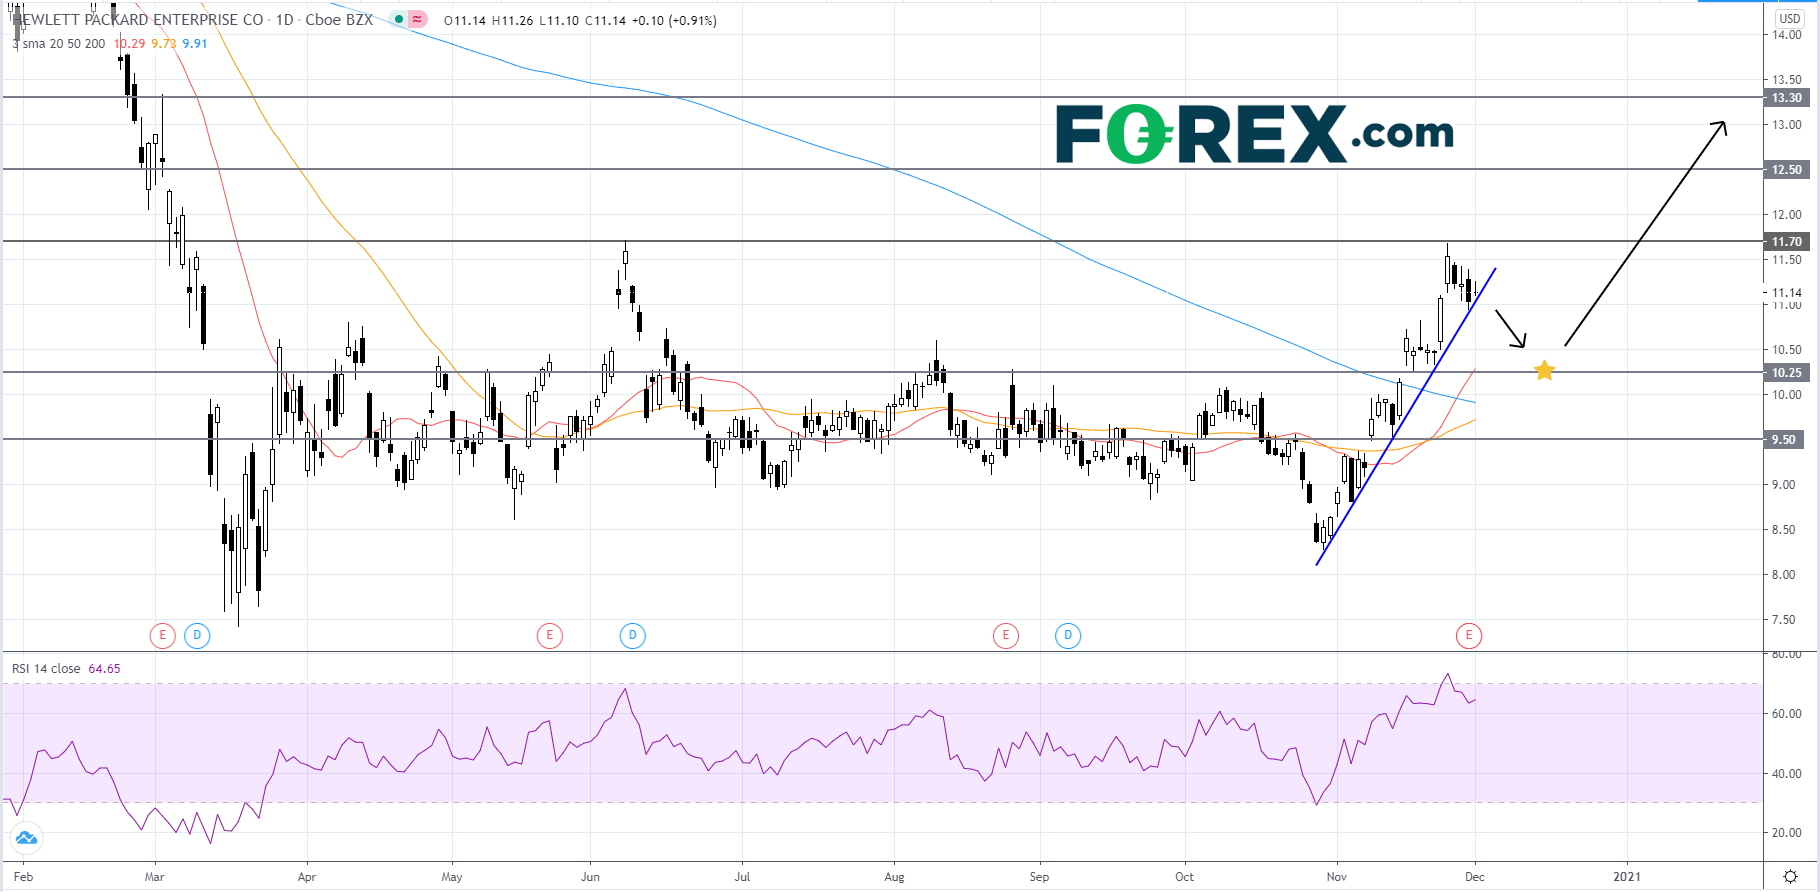
Technically speaking, on a daily chart, Hewlett Packard's stock price has been rising in a steep short-term up trend since October 30th. The RSI has just pulled back from overbought territory and is holding above 60. HPE entered a new up trend on November 16th after price crossed above the 200-day simple moving average (SMA). If the 50-day SMA crosses above the 200-day SMA it would be another bullish signal. Given the RSI reading and the sharp angle of the short-term up trend, price could potentially retreat before continuing to advance towards the last peak of 11.70. If price falls below the bullish trendline then traders should look for a bounce off of 10.25. If price is supported at 10.25, it will probably retest 11.70. If price can break above 11.70 its next targets would be 12.50 and 13.30. However, if price fails to find support at 10.25 then traders should look to 9.50 for a rebound. If price drops below 9.50 it would be a bearish signal that could send price tumbling lower.

Source: GAIN Capital, TradingView
Technically speaking, on a daily chart, Hewlett Packard's stock price has been rising in a steep short-term up trend since October 30th. The RSI has just pulled back from overbought territory and is holding above 60. HPE entered a new up trend on November 16th after price crossed above the 200-day simple moving average (SMA). If the 50-day SMA crosses above the 200-day SMA it would be another bullish signal. Given the RSI reading and the sharp angle of the short-term up trend, price could potentially retreat before continuing to advance towards the last peak of 11.70. If price falls below the bullish trendline then traders should look for a bounce off of 10.25. If price is supported at 10.25, it will probably retest 11.70. If price can break above 11.70 its next targets would be 12.50 and 13.30. However, if price fails to find support at 10.25 then traders should look to 9.50 for a rebound. If price drops below 9.50 it would be a bearish signal that could send price tumbling lower.

Source: GAIN Capital, TradingView
Latest market news
Today 04:56 AM
Yesterday 08:00 PM
Yesterday 08:00 PM
Yesterday 07:33 PM
Yesterday 07:16 PM
