With three central bank meetings on the schedule today (see my colleague Fawad Razaqzada’s reports from earlier today for previews and recaps of the BOE, ECB, and CBRT meetings) , FX traders have been understandably focused away from the world’s reserve currency. However, dollar bulls who were keyed in on this week’s inflation data were no doubt disappointed.
After last week’s surprisingly strong reading in average hourly earnings, economists were hoping to see signs that price pressures had finally “turned the corner” to consistently higher readings; this week’s data has dashed (or at least postponed) those hopes. Yesterday’s PPI report showed a surprising -0.1% m/m decline in both headline and core PPI figures for August, bringing the year-over-year rate to just 2.8%, well below the 3.3% rate expected.
Adding insult to injury, today’s CPI report also missed expectations, rising just 0.2% m/m (core only ticked higher by 0.2%), leaving the year-over-year rate at 2.7%. In other words, this week’s inflation figures have some analysts wondering whether the unexpectedly strong wage growth from Friday’s NFP report was merely statistical noise, rather than the start of a new trend of rising prices. This is a topic the Federal Reserve will be watching closely in the coming months as it decides whether to raise interest rates again in December (a rate hike in two weeks’ time is all but a done deal at this point).
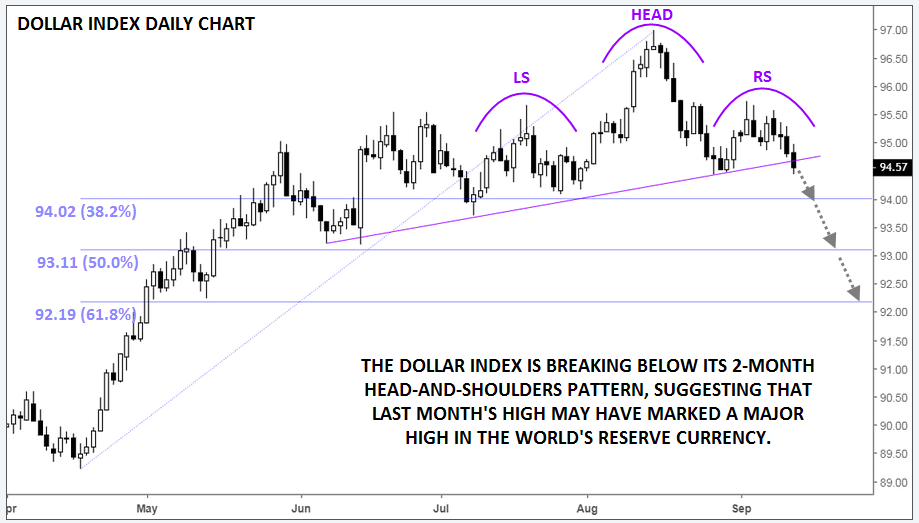
The chart of the dollar index gives bulls even more reason to worry. As the daily chart below shows, the index has carved out a head-and-shoulders pattern over the last two months; for the uninitiated, this pattern shows a transition from a bullish trend (higher highs and higher lows) to a bearish trend (lower highs and lower lows) and is often seen at significant tops in the market. With prices on track to close below the pattern’s “neckline” around 94.75 today, the pattern projects a possible move down toward 92.00 in time. From a shorter-term perspective, the Fibonacci retracements of the April-August rally at 94.02 (38.2%), 93.11 (50%), and 92.19 (61.8%) could provide support along the way.
Of course, we’d never endorse trading off a single pattern or indicator, but readers should at least keep their minds open to the possibility that the greenback may have seen its highest levels of the year last month.

Source: TradingView, FOREX.com


