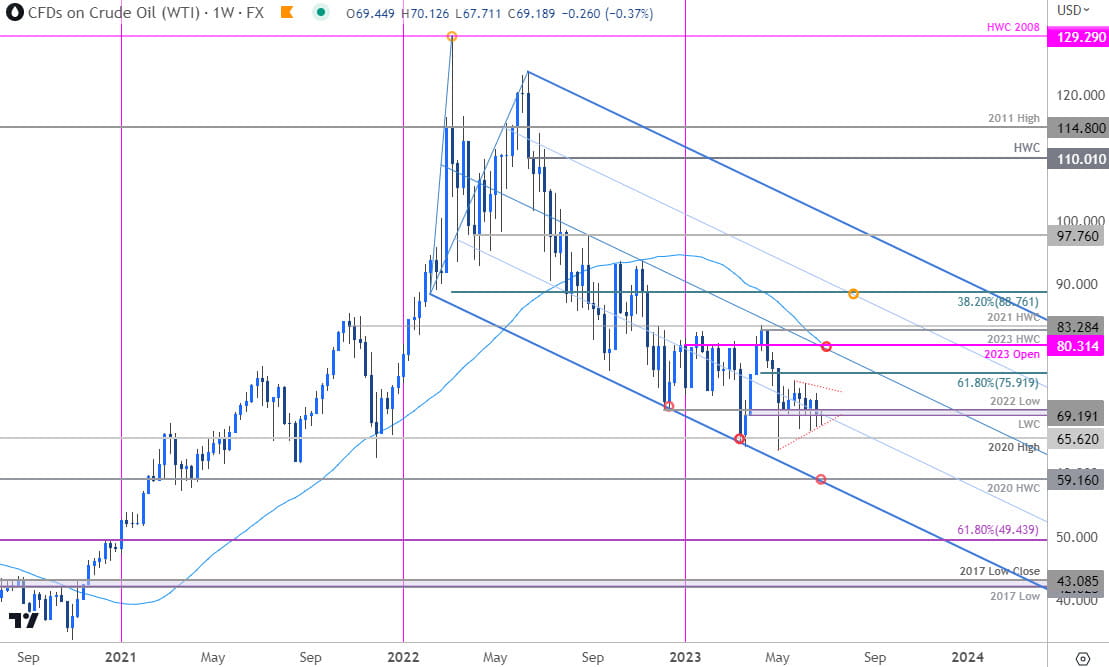
Crude Oil Technical Forecast: WTI Weekly Trade Levels
- Crude grinds into support for a ninth-consecutive week
- Oil coils within monthly range- breakout imminent
- WTI resistance 75.91, 80.31, 82.68-83.28- support 69.19-70.06 (key), 65.62, 59.16
Crude oil prices are grinding into technical support with a breakout of a nine-week consolidation pattern now imminent. These are the updated targets and invalidation levels that matter on the WTI weekly technical chart heading into the close of the month / quarter.
Review my latest Weekly Strategy Webinar for an in-depth breakdown of this crude oil setup and more. Join live on Monday’s at 8:30am EST.
Crude Oil Price Chart – WTI Weekly

Chart Prepared by Michael Boutros, Technical Strategist; WTI on TradingView
Technical Outlook: In last month’s Crude Oil Price Forecast we noted that WTI had been, “sitting at support all month and the focus is on possible price inflection into this zone. From a trading standpoint, a good region to reduce portions of short-exposure / lower protective stops with a weekly close below 69.19 needed to mark resumption of the broader downtrend.” Despite numerous intraweek attempts, price has been unable to mark a weekly close below this threshold with a nine-week consolidation pattern now straddling support- breakout pending.
Key support remains with the yearly low-week close / 2022 low at 69.19-70.09 with a break of this symmetrical wedge formation needed to fuel the next leg lower in price towards the 2020 high at 65.62 and the 2020 high-week close / lower parallel around 59.16- look for a larger reaction there IF reached.
A topside breach of this formation exposes the 61.8% Fibonacci retracement of the yearly range at 75.91 and the objective yearly open / 52-week moving average at 80.31/70. Ultimately a close above the 2023/2021 high-week closes at 82.68-83.28 would be needed to validate a breakout of the yearly opening-range and technical shift the focus back to the topside in crude prices.
Bottom line: Crude oil prices continue to coil around a key support pivot – watch the weekly closes. From a trading standpoint, the focus is on a breakout of this consolidation pattern in the weeks ahead for guidance. Keep in mind we are heading into the close of the month / quarter and the risk of a washout remains– stay nimble here. I’ll publish an updated crude oil short-term outlook once we get further clarity on the near-term WTI technical trade levels.
Active Weekly Technical Charts
- Gold (XAU/USD)
- Canadian Dollar (USD/CAD)
- Euro (EUR/USD)
- Japanese Yen (USD/JPY)
- Australian Dollar (AUD/USD)
- British Pound (GBP/USD)
- US Dollar (DXY)
--- Written by Michael Boutros, Sr Technical Strategist with FOREX.com
Follow Michael on Twitter @MBForex


