- Financialisation of crude oil and iron ore means you need to pay attention to price action as much as fundamentals
- Having fallen to YTD lows, both markets look like they may have bottomed in the near-term
- China industrial production, property construction data released this weekend
Overview
If you purely focus on the fundamentals of crude oil and iron ore, you’d be rightly feeling bearish. Both look oversupplied relative to demand in the near-term, with the added threat of a more pronounced global economic slowdown. However, fundamentals and direction don’t always agree in these increasingly financialised markets, meaning you should arguably put just as much emphasis on price action to guide your investment decisions.
WTI crude oil long setup
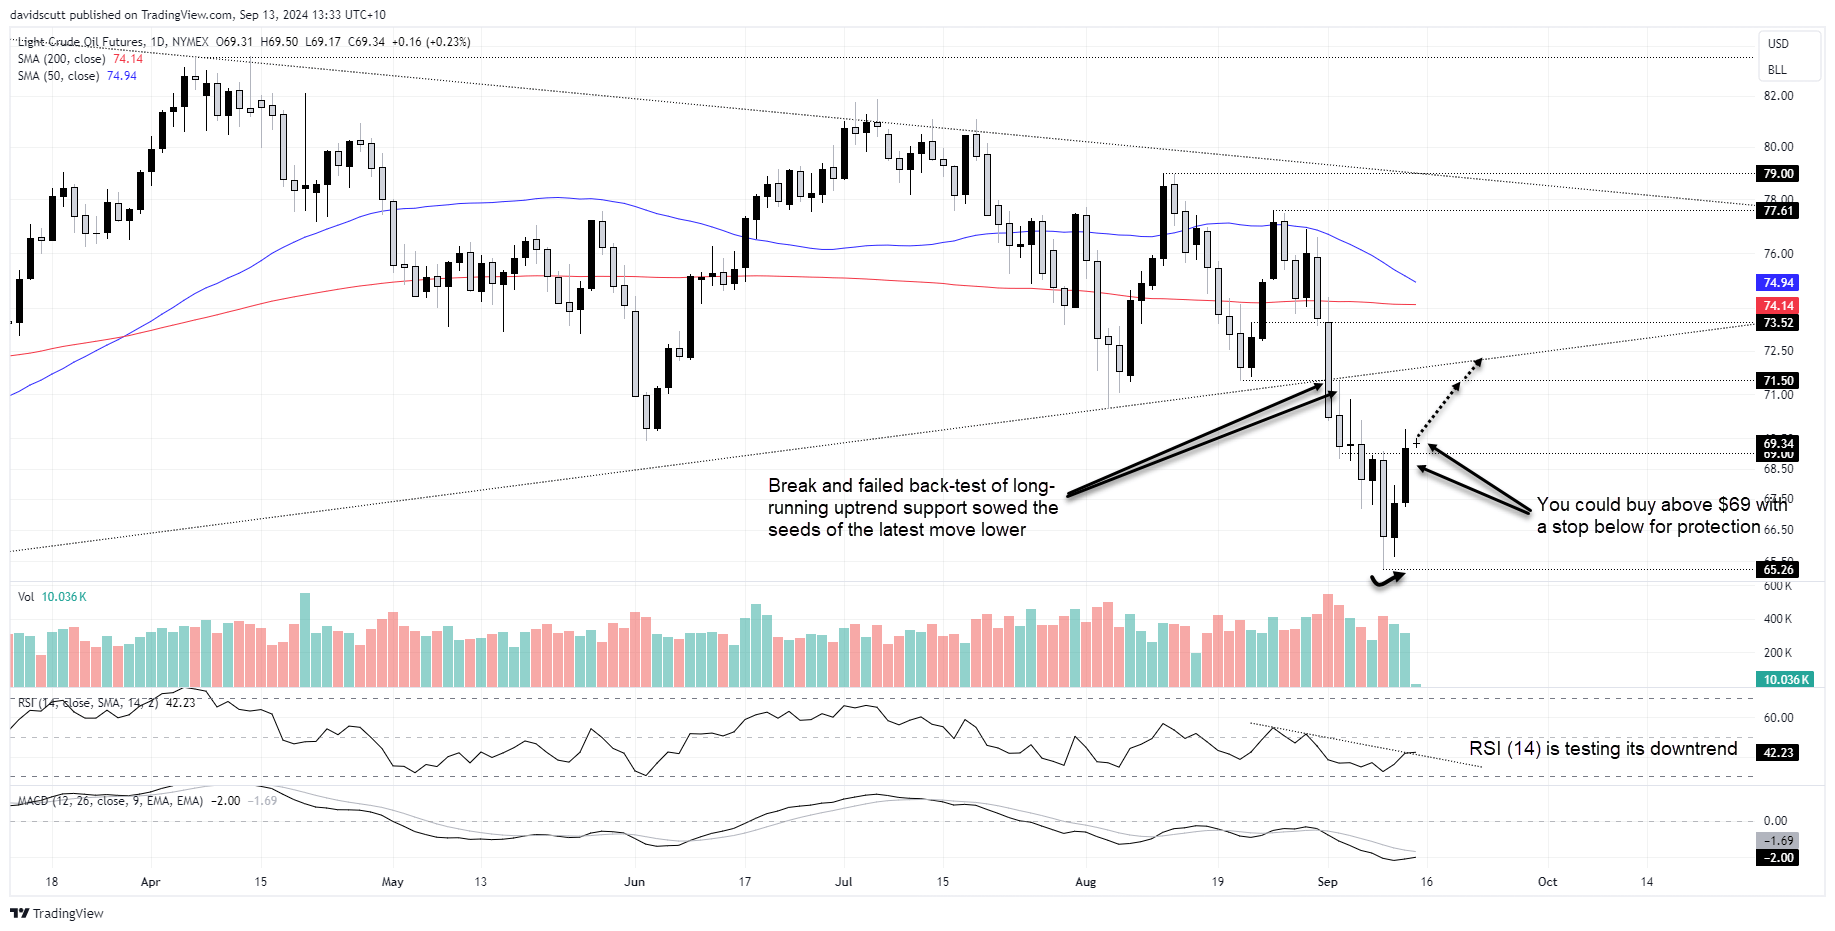
WTI crude oil has behaved exactly as you’d expect after slicing through long-running uptrend support on big volumes, dribbling lower after a failed back-test of the level. Rallies were sold into, as demonstrated by the long topside wicks of some of the daily candles, eventually finding a floor at $65.26.
While undeniably bearish, the price action has been more constructive recently. After being bought off the lows on Tuesday below $66, the same price action was seen on Wednesday, likely contributing to the bullish candle that printed Thursday.
One look at the daily tells you there’s decent two-way flow around $69, as demonstrated by the price action around the level over the past two weeks. Now that it has cleared the level, it increases the probability we may see an extension higher.

Those considering taking on the long trade could buy around these levels with a stop below $69 for protection. Targets include $71.50 and former uptrend located just above. If the price were to break back above the latter, $73.52 would be the next logical target.
If the price were to break to reverse back below the $69, the near-term bullish bias would be negated.
Momentum is starting to show signs of turning bullish, with RSI (14) looking like it may break the downtrend it’s been in since late August. MACD has yet to confirm, although it looks like it’s starting to flick higher towards the signal line.
SGX iron ore setups around $95.40
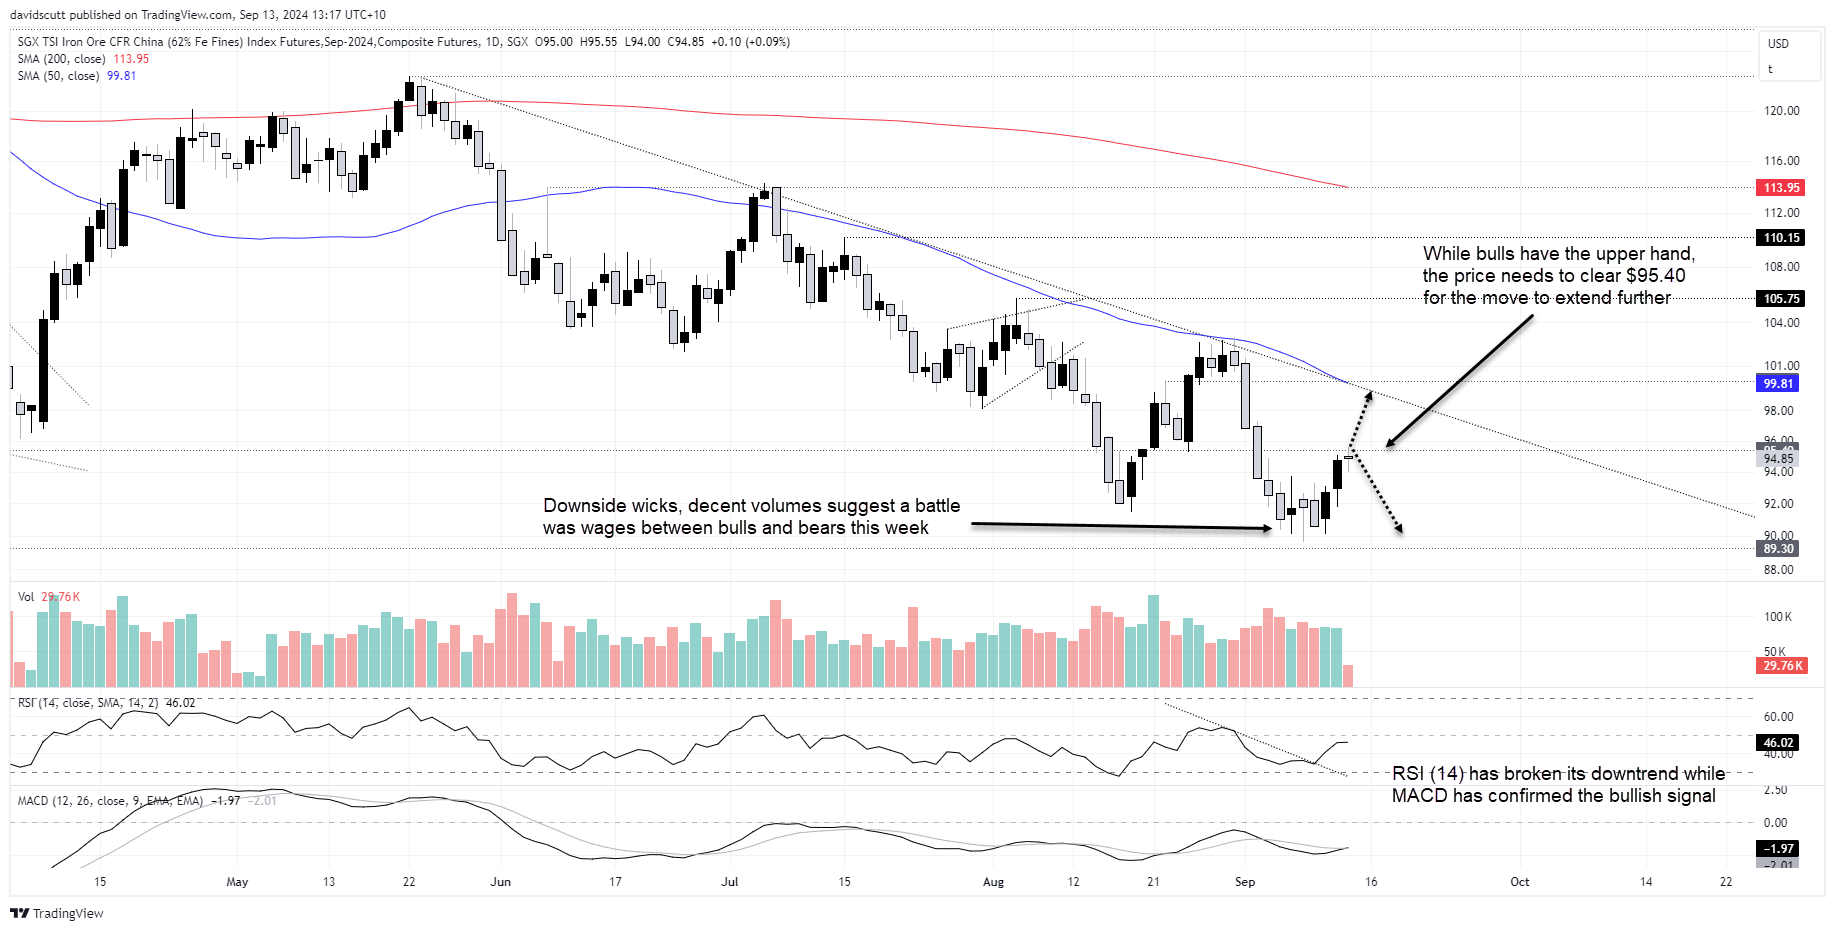
SGX iron ore sits in a similar position to crude with the price in a clear downtrend but some evidence it may have bottomed. The downside wicks on the daily candles below $91, accompanied by decent volumes, suggests a battle between bulls and bears was waged over the past week, with the recent price action pointing to bulls gaining the upper hand.

RSI (14) has broken its downtrend with MACD confirming the bullish signal, pointing to a shift bearish momentum. Given that and recent price action, traders should be on alert for a potential break above resistance at $95.40. If it were to go, longs could be established above the figure with tight stop below. The initial target would be around $99, the current location of the 50-day moving average and downtrend dating back to May. If that level were to break, it could lead to a far greater extension of the rebound.
If $95.40 were to hold firm the trade could be flipped, with shorts established beneath the level with a tight stop above. $90 would be one target with longer-running support at $89.30 the next after that.
Chinese industrial production and fixed asset investment data for August will be released on Saturday, including information on steel production and property construction. With pessimism elevated, it would have to take a terrible outcome to deliver a true downside surprise. It also leaves room for upside if the data suggests extreme pessimism is not warranted.
-- Written by David Scutt
Follow David on Twitter @scutty


