US headline CPI for September was 0.0% vs 0.1% expected and 0.1% last. However, the more important Core CPI (YoY) for September was 2.4%, as expected, and 2.4% last. Core CPI is the measure of CPI ex-food and ex-energy. This is one of the Fed’s key measures of inflation, which remains above the Fed’s 2.0% inflation target. As the Minutes from the September have shown, the Fed was slightly more hawkish in their latest assessment. However, since that meeting, manufacturing and PPI data have come out worse than expected. The Fed needs to see if these leading indicators feed through to the rest of the economy, which is why they remain data dependent.
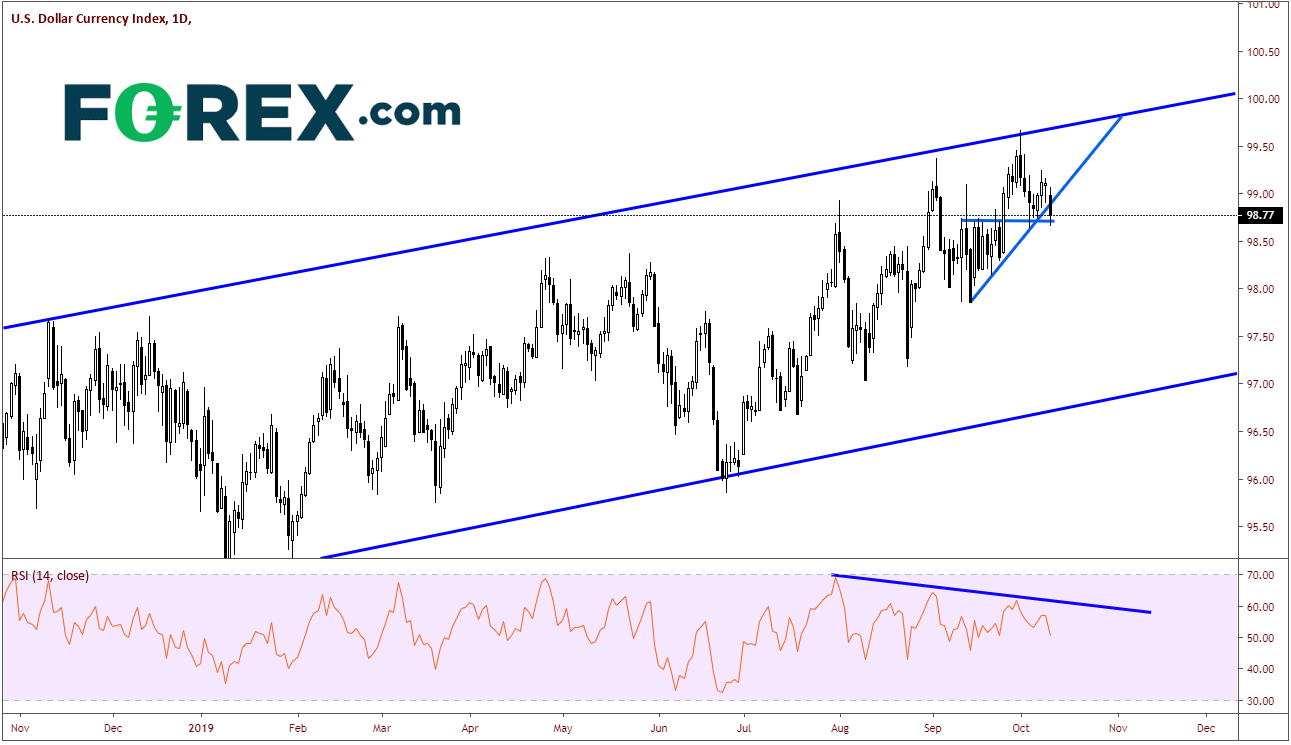
Upon release of the data, the US Dollar Index (DXY) was trading near the lows of the day at 98.75 as speculation swirls regarding the US-China trade discussions. DXY has been in an upward channel since May 2018. However, since September 13th, the US Dollar Index has been forming a rising wedge within that longer-term channel. Today price broke lower out that that wedge. The target for the breakdown of a rising wedge is a 100% retracement. However, price has held strong horizontal support at the 50% retracement of the wedge, which is 98.76.

Source: Tradingview, FOREX.com
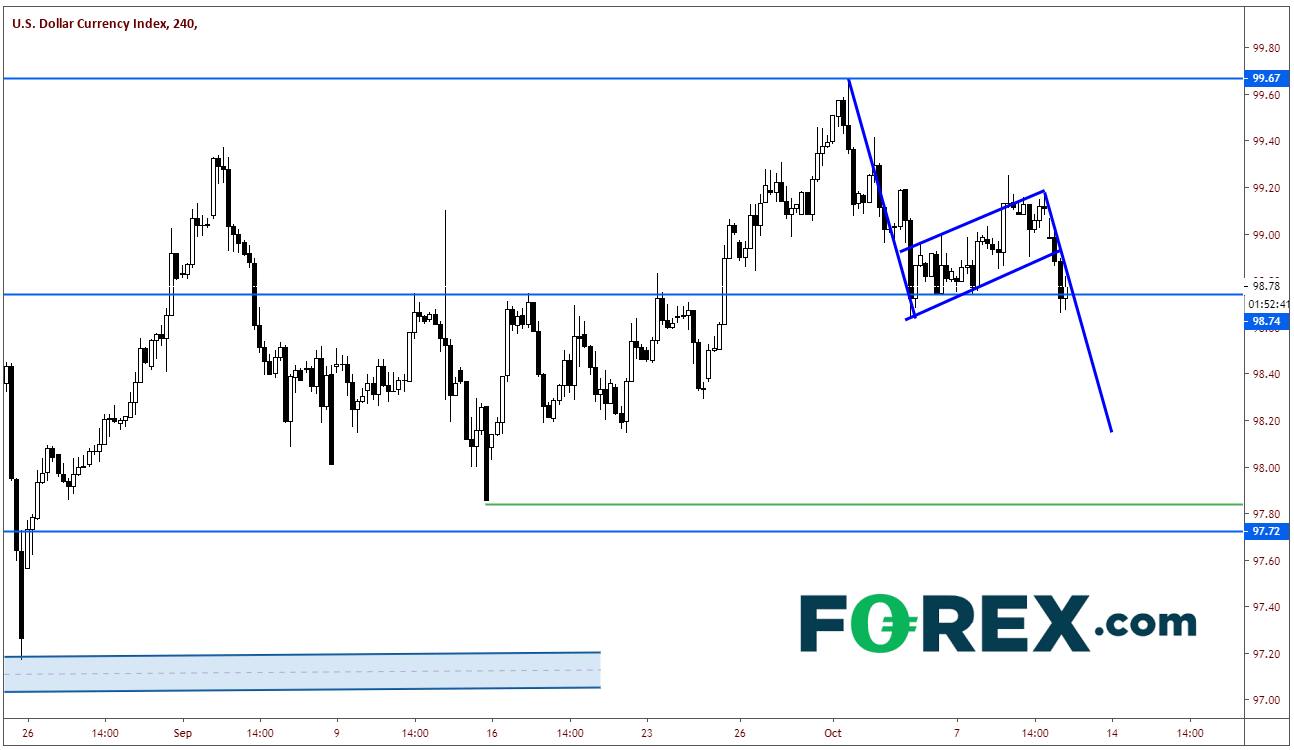
On a 240-minute chart DXY is putting in a flag formation. After moving lower from the highs of 99.67, price moved to the horizontal support at 98.76, and bounced. As DXY broke lower today out of the rising wedge, it also broke out of the flag and is once again testing that horizontal support area. The target for the breakout of a flag is the length of the flagpole added to the high before the breakout of the flag formation, which in this case is 98.15.

Source: Tradingview, FOREX.com
If DXY can close today below the 98.76 horizontal level, probabilities increase that price will aim for the flag target level at 98.15 as well as the target level of the ascending wedge at 97.84. If we reach those targets, watch for a move to test the upward sloping trendline near 97.00. Horizontal resistance above at yesterdays spike lows at 98.90. Above there, DXY can shoot all the way to previous highs at 99.67 if patterns fail.
Of course, as we have been mentioning all week, keep an eye out for headlines and tweets regarding the China-US trade talks.


