Canadian Dollar Technical Forecast: USD/CAD Weekly Trade Levels
- Canadian Dollar coil continues within yearly opening-range- breakouts pending
- USD/CAD recovery off lower bounds now testing yearly-open resistance
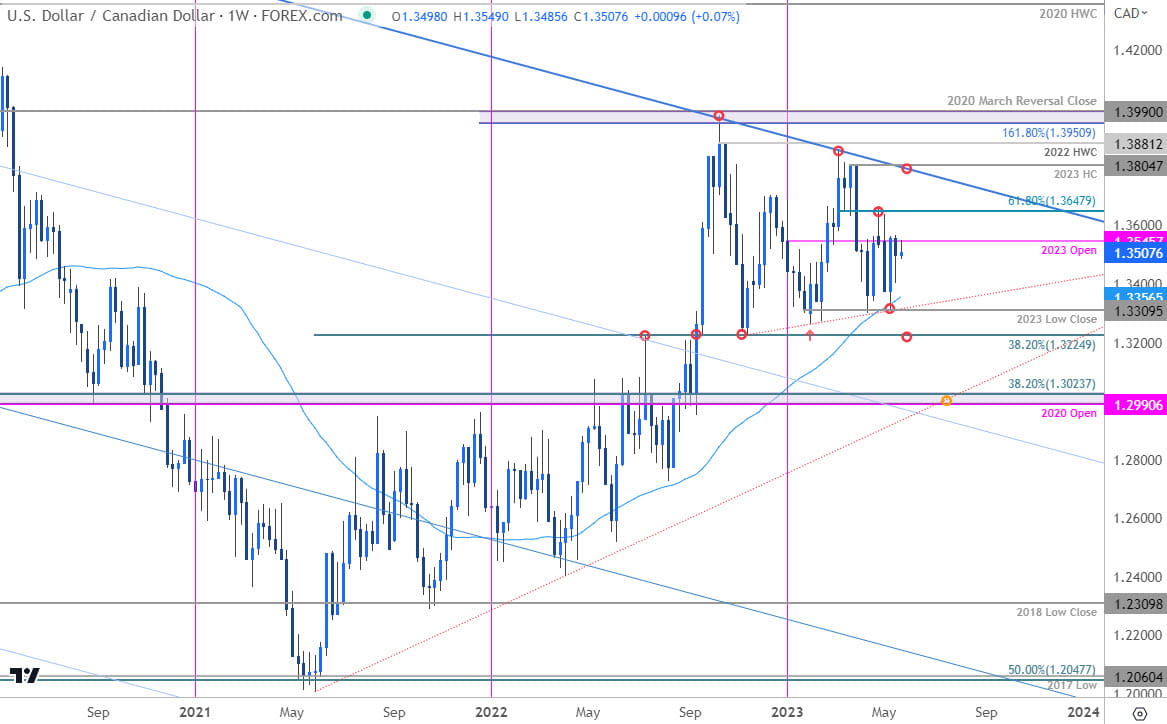
- Resistance 1.3545, 1.3648, 1.3805 (key)– support 1.3356, 1.3309, 1.3225 (key)
The Canadian Dollar is trading just below the yearly-open with USD/CAD continuing to contract within a massive multi-month consolidation pattern. Battle lines are drawn as we look for a breakout of a range within a range. These are the updated targets and invalidation levels that matter on the USD/CAD weekly technical chart.
Review my latest Weekly Strategy Webinar for an in-depth breakdown of this Loonie setup and more. Join live on Monday’s at 8:30am EST.
Canadian Dollar Price Chart – USD/CAD Weekly

Chart Prepared by Michael Boutros, Sr. Technical Strategist; USD/CAD on TradingView
Technical Outlook: In last month’s Canadian Dollar Technical Forecast we continued to highlight this massive multi-month consolidation in USD/CAD while noting that the, “advance is testing resistance this week at the 61.8% Fibonacci retracement of the March decline at 1.3648- looking for possible near-term inflection off this mark.” Price briefly registered an intraweek high at 1.3667 that week before turning sharply lower with a rebound off the lower bounds taking USD/CAD back into yearly-open resistance at 1.3545. The price contraction continues. . .
The momentum profile has completely flattened here and makes this an even tougher trade at these levels. Ultimately a breach above Fibonacci resistance is needed to fuel another run-on multi-year slope resistance around the 2023 high-close at 1.3805- look for a larger reaction there IF reached.
Initial support rests with the 52-week moving average (currently ~1.3356) backed by the yearly low-close at 1.3309. A break / weekly close below the 38.2% retracement of the 2021 advance at 1.3225 would be needed to validate a breakout of the yearly opening range towards the 1.30-handle.
Bottom line: USD/CAD is sitting just below yearly-open resistance in the middle of a massive consolidation patter. The immediate focus is on a breakout of the 1.3309-1.3647 range for guidance with a break of the larger multi-month consolidation pattern ultimately needed to validate the next leg within the broader 2021 advance. From a trading standpoint, losses should be limited to the yearly moving average IF price is heading higher on this stretch. Review my latest Canadian Dollar short-term outlook for a closer look at the near-term USD/CAD technical trade levels.
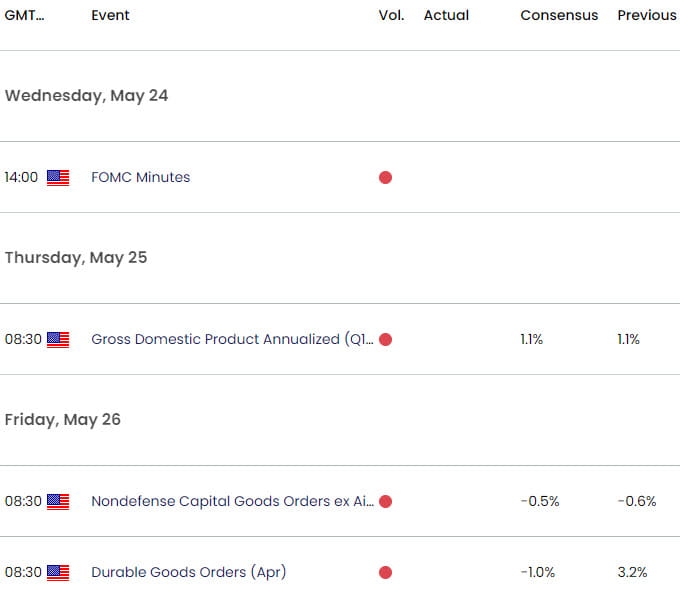
Key Economic Data Releases

Economic Calendar - latest economic developments and upcoming event risk.
Active Weekly Technical Charts
- S&P 500, Nasdaq, Dow Jones
- Euro (EUR/USD)
- Japanese Yen (USD/JPY)
- Australian Dollar (AUD/USD)
- US Dollar (DXY)
- Gold (XAU/USD)
- British Pound (GBP/USD)
- Crude Oil (WTI)
--- Written by Michael Boutros, Sr Technical Strategist with FOREX.com
Follow Michael on Twitter @MBForex


