Canadian Dollar Technical Forecast: USD/CAD Weekly Trade Levels
- USD/CAD attempting to mark fifth-weekly advance- US inflation, NFPs on tap
- Bulls attempting breakout of major resistance pivot today- focus on weekly close
- Resistance 1.3881/99, 1.3984/99 (key), 1.4115– Support ~1.3830s, 1.3745/73 (key), ~1.3609
USD/CAD surged more than 3.7% off the September lows with the rally now attempting to breach a major resistance zone near the 2023 highs. Battle lines drawn on the USD/CAD weekly technical chart heading into NFPs / November open.
Review my latest Weekly Strategy Webinar for an in-depth breakdown of this Loonie setup and more. Join live on Monday’s at 8:30am EST.Canadian Dollar Price Chart – USD/CAD Weekly

Chart Prepared by Michael Boutros, Sr. Technical Strategist; USD/CAD on TradingView
Technical Outlook: In my last Canadian Dollar Technical Forecast we noted that a reversal off support at multi-month lows was approaching initial resistance and that, “losses should be limited to 1.3517 IF price is heading for a breakout here with a close above 1.3647 needed to fuel the next leg higher.” USD/CAD broke higher that week with price now extending more than 3.7% off the September lows. Note that weekly momentum has also reached the highest levels of the year and a breach above 70 would offer further validation for the breakout of the multi-year consolidation pattern.
The rally attempting to mark a fifth-consecutive weekly advance with USD/CAD now testing pivotal resistance at 1.3881/99- a region defined by the 2022 high-week close (HWC) and the April high-close (HC). A breach / weekly close above this threshold is needed to mark uptrend resumption towards the next major technical hurdle at the 2020 March reversal close / 100% extension of the 2023 advance at 1.3984/99- look for a larger reaction there IF reached. Subsequent resistance is eyed at the 2016 HWC at 1.4115 and the 100% extension of the December advance at 1.4189.
Look for initial weekly support along the median-line (currently near ~1.3830s) backed the 61.8% retracement of the August decline / April high-0clsoe at 1.3745/77- losses should be limited to this threshold IF price is heading higher on this stretch with a break below the median-line threatening a retest of the yearly moving average near ~1.3609.
Bottom line: USD/CAD is attempting to breach technical resistance here into the 1.39-handle and the focus is on a weekly close above this threshold. From a trading standpoint, a good zone to reduce portions of long-exposure / raise protective stops- losses should be limited to the 1.3745 IF price is heading higher on this stretch with a close above this pivot zone needed to keep the focus on a rally towards 1.3990- an area of interest for possible topside exhaustion / price inflection If reached.
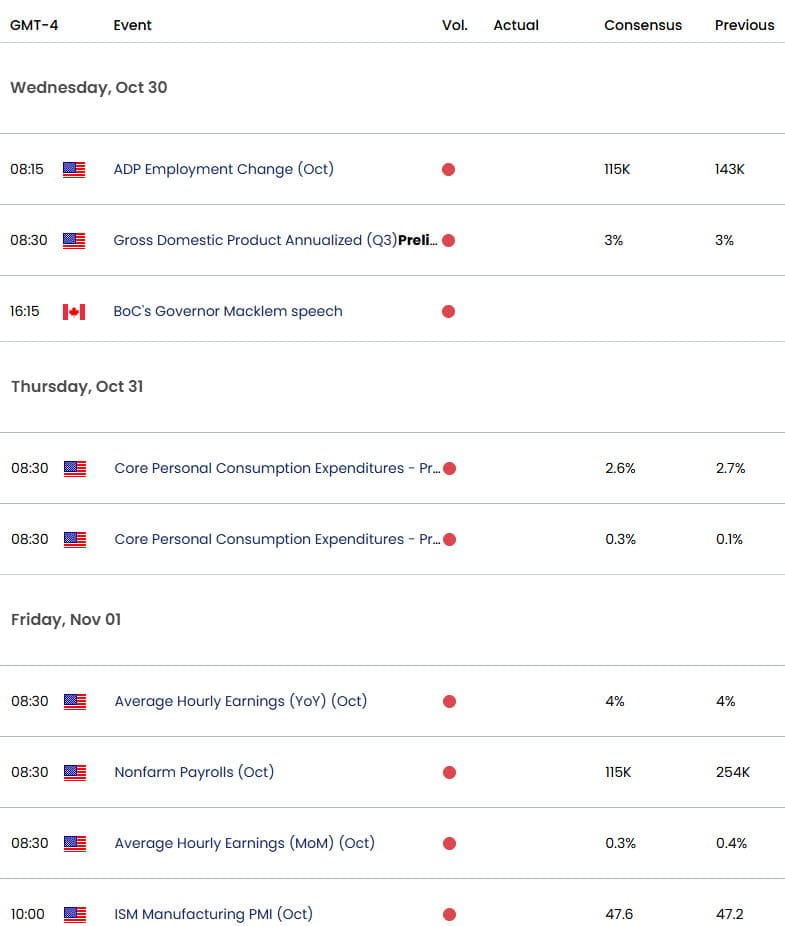
Keep in mind we have major US inflation data on tap into the monthly close with NFPs slated for Friday. Stay nimble into the monthly cross and watch the weekly close here for guidance. Review my latest Canadian Dollar Short-term Outlook for a closer look at the near-term USD/CAD technical trade levels.
US/ Canada Economic Data Release

Economic Calendar - latest economic developments and upcoming event risk.
Active Weekly Technical Charts
- Euro (EUR/USD)
- British Pound (GBP/USD)
- US Dollar Index (DXY)
- Australian Dollar (AUD/USD)
- Gold (XAU/USD)
- Japanese Yen (USD/JPY)
- Crude Oil (WTI)
--- Written by Michael Boutros, Sr Technical Strategist with FOREX.com
Follow Michael on X @MBForex


