Canadian Dollar Technical Forecast: USD/CAD Weekly Trade Levels
- Canadian Dollar marks breakout of major multi-month consolidation pattern
- USD/CAD poised for third-weekly decline– key support objectives now in view
- Resistance 1.3309, ~1.3388, 1.3545 (key)– support 1.3107/20, 1.2990-1.3023(key)
The Canadian Dollar surged nearly 4% against the US Dollar since the May extremes with USD/CAD plunging through the 2023 yearly opening-range lows. A breakout of the November consolidation pattern keeps the outlook weighted to the downside with major support objectives now in view. These are the updated targets and invalidation levels that matter on the USD/CAD weekly technical chart.
Review my latest Weekly Strategy Webinar for an in-depth breakdown of this Loonie setup and more. Join live on Monday’s at 8:30am EST.
Canadian Dollar Price Chart – USD/CAD Weekly

Chart Prepared by Michael Boutros, Sr. Technical Strategist; USD/CAD on TradingView
Technical Outlook: In last month’s Canadian Dollar Technical Forecast we noted that USD/CAD was, “sitting just below yearly-open resistance in the middle of a massive consolidation patter. The immediate focus is on a breakout of the 1.3309-1.3647 range for guidance…” Price briefly registered an intra-day high at 1.3654 the following week before reversing sharply lower with a three-week decline plunging through support on the heels of the FOMC rate decision.
A weekly close at these levels is technically significant in that it validates a breakout of the yearly opening-range, the larger October consolidation pattern, and a move back below the 52-week moving average for the first time since May of 2022. Also note that weekly momentum has dropped to the lowest levels since June of 2021 with the last break below 40 in RSI eyed in late 2020- in that instance, price saw another 7.5% decline before bottoming six-months later. As bearish as that may sound, we still have not invalidated the broader 2021 uptrend and the immediate threat remains for a test of multi-year trend support.
A close below the 38.2% Fibonacci retracement of the 2021 rally at 1.3225 this week would keep the focus on subsequent support objectives at 1.3107/20 (two-equal legs off the 20223 / 2022 highs respectively) and 1.2990-1.3023- an area of interest for possible downside exhaustion IF reached (broader bullish invalidation for the 2021 uptrend).
Resistance now stands back at the January low-close at 1.3309 with near-term bearish invalidation now set to the yearly moving average, currently near ~1.3388. Ultimately, a breach / close above the objective yearly open at 1.3545 would be needed to invalidation the entire March downtrend.
Bottom line: USD/CAD is now poised to breakout of numerous technical formations and threatens a test multi-year uptrend support. From at trading standpoint, look to reduce short-exposure / lower protective stops on a stretch towards channel support- rallies should be limited to the 1.33-handle IF price is heading lower here. Review my latest Canadian Dollar Short-term Outlook for a closer look at the near-term USD/CAD technical trade levels.
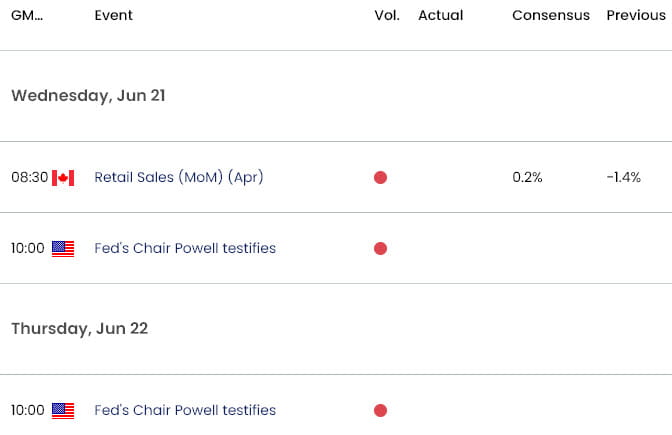
Key Economic Data Releases

Economic Calendar - latest economic developments and upcoming event risk.
Active Weekly Technical Charts
- Euro (EUR/USD)
- Japanese Yen (USD/JPY)
- Australian Dollar (AUD/USD)
- British Pound (GBP/USD)
- US Dollar (DXY)
- Gold (XAU/USD)
- Crude Oil (WTI)
- S&P 500, Nasdaq, Dow Jones
--- Written by Michael Boutros, Sr Technical Strategist with FOREX.com
Follow Michael on Twitter @MBForex


