British Pound technical forecast: GBP/USD weekly trade levels
- British Pound defends 2023 opening-range
- GBP/USD rally approaching key pivot zone at the yearly range high
- Sterling resistance ~1.2397-1.2448 (key), 1.2773– support 1.1783-1.1841, 1.1632/44 (key),
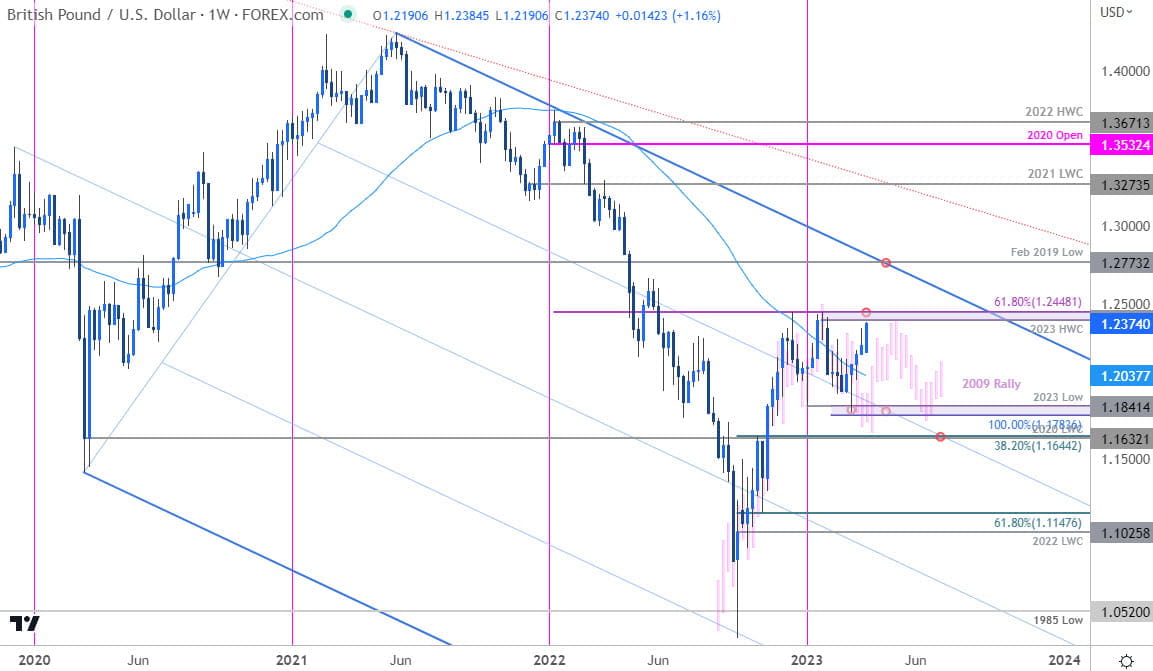
The British Pound is attempting to mark a fifth consecutive weekly advance with GBP/USD rallying nearly 5% off the monthly / yearly lows. The rally is now approaching a critical pivot zone at the yearly highs and we’re on the lookout for a possible reaction on a stretch higher here. These are the updated targets and invalidation levels that matter on the GBP/USD weekly technical chart.
Discuss this gold setup and more in the Weekly Strategy Webinars on Monday’s at 8:30am EST.
British Pound Price Chart – GBP/USD Weekly

Chart Prepared by Michael Boutros, Sr. Technical Strategist; GBP/USD on TradingView
Technical Outlook: In last month’s British Pound Weekly Forecast we noted that the sell-off in GBP/USD was approaching key support and the focus was on, “on a possible reaction off a key technical confluence at 1.1783-1.1841- a region defined by the 100% extension of the recent decline and the objective 2023 opening-range low.” Sterling registered an intraweek low at 1.1803 in the following weeks before reversing sharply higher with the advance now approaching key resistance at the yearly opening-range highs at 1.2397-1.2448- a region defined by the yearly high-week close and the 61.8% Fibonacci retracement of the 2022 decline. Risk for topside exhaustion / price inflection into this zone over the next few weeks.
Initial weekly support now rests back with the 52-week moving average (currently ~1.2037) backed by 1.1783-1.184. A break / weekly close below the 2020 low-week close / 38.2% retracement at 1.1632/44 is ultimately needed to mark resumption of the broader downtrend.
A topside breach of this key resistance zone would expose multi-year downtrend (blue) at the February 2019 low around 1.2773- look for a larger reaction there IF reached.
British Pound Price Chart – GBP/USD Weekly (2009 Price Parallel)

Chart Prepared by Michael Boutros, Sr. Technical Strategist; GBP/USD on TradingView
Revisiting the price parallel presented last month with the 2009 rally (pink) – the parallel is off by a few weeks but given the construct, the focus remains on possible inflection into technical resistance just higher.
Bottom line: The British Pound reversed off key support with a five-week rally now approaching key resistance at the yearly opening-range highs. From a trading standpoint, a good zone to reduce long-exposure / raise protective stops – losses should be limited to the yearly moving average IF price is heading higher on this stretch. Note that we are heading into a key pivot zone into the close of the week, month, and quarter – tread lightly here and stay nimble into the April open. I’ll publish an updated British Pound short-term outlook once we get further clarity on the near-term GBP/USD technical trade levels.
Key Economic Data Releases

Economic Calendar - latest economic developments and upcoming event risk.
Active Weekly Technical Charts
- Gold (XAU/USD)
- US Dollar Index (DXY)
- Crude Oil (WTI)
- Japanese Yen (USD/JPY)
- Australian Dollar (AUD/USD)
- Euro (EUR/USD)
- Canadian Dollar (USD/CAD)
- S&P 500 (SPX500)
--- Written by Michael Boutros, Sr Technical Strategist with FOREX.com
Follow Michael on Twitter @MBForex


