British Pound Technical Forecast: GBP/USD Weekly Trade Levels
- British Pound rally falters ahead of multi-year trend resistance
- GBP/USD holding support for a third-week – focus is on breakout of this week’s range
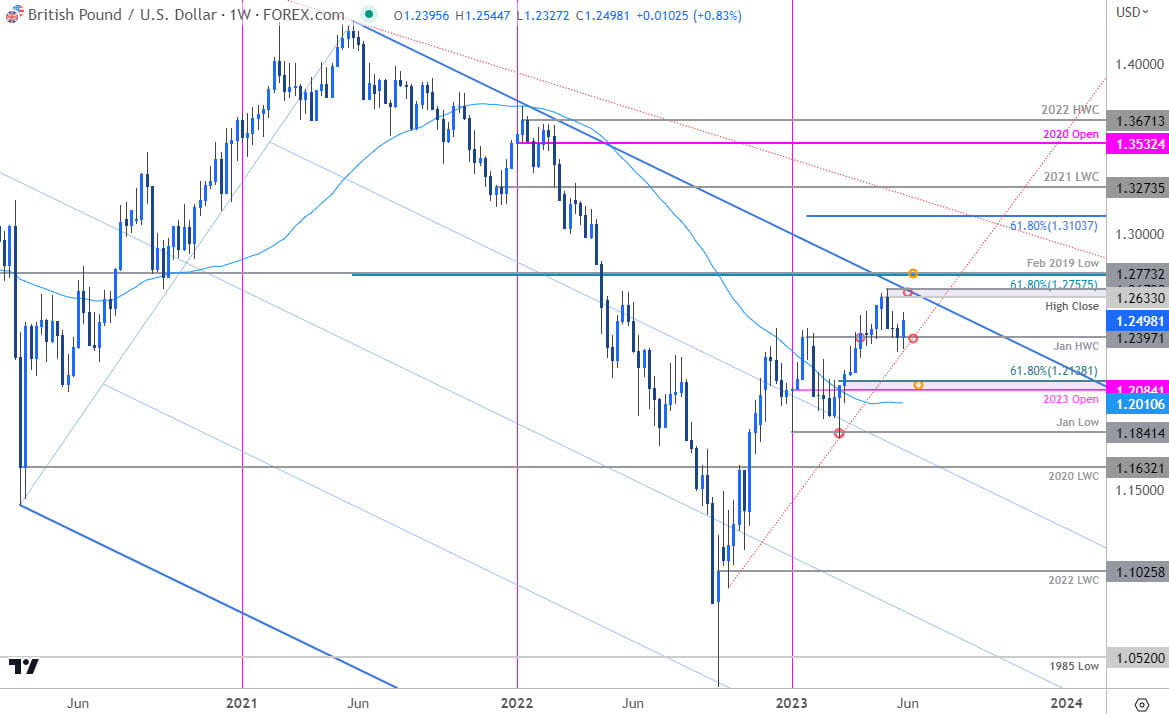
- Sterling resistance 1.2537, 1.2633/79, 1.2757/73– support 1.2397, 1.2084-1.2138, ~1.2010
The British Pound is attempting to snap a three-week losing streak with GBP/USD up nearly 0.5% ahead of the close on Friday. While a rebound off support may have further upside potential near-term, the broader threat remains for a larger correction after turning from multi-year trend resistance (blue). These are the updated targets and invalidation levels that matter on the GBP/USD weekly technical chart.
Review my latest Weekly Strategy Webinar for an in-depth breakdown of this Sterling setup and more. Join live on Monday’s at 8:30am EST.
British Pound Price Chart – GBP/USD Weekly

Chart Prepared by Michael Boutros, Sr. Technical Strategist; GBP/USD on TradingView
Technical Outlook: In last month’s, British Pound Weekly Forecast we noted that a breakout of the yearly opening-range highs in GBP/USD shifted the medium-term focus higher with the advance within striking distance of, “a key technical confluence at multi-year trend resistance around 1.2757/73- a region defined by the 61.18% retracement of the 2021 decline and the February 2019 low (an area of interest for possible exhaustion / price inflection IF reached).”
Sterling registered an intraweek high at 1.2679 the following week before reversing sharply lower with the decline sitting at support around the January high-week close at 1.2397 for the past three-weeks- price has been unable to mark a weekly close below. . .
Initial weekly resistance is now eyed at the 2023 high-close / high at 1.2633/79 with a breach / weekly close above the 1.2757/73 ultimately needed to mark resumption of the 2022 uptrend towards 1.31.
A break / close below the October trendline (red) would suggest a deeper correction may be underway with such a scenario exposing key support at 1.2084-12138- a region define by the objective yearly open and the 61.8% Fibonacci retracement of the yearly range. Look for a larger reaction there IF reached.
Bottom line: Sterling faltered just ahead of multi-year downtrend resistance with the pullback now reacting to initial support- the rebound has already completed 61.8% retracement of the pullback (not shown) and the immediate focus is on a breakout of this week’s range for guidance. From a trading standpoint, the threat remains for a deeper setback while below 1.2633/79. I’ll publish an updated British Pound short-term outlook once we get further clarity on the near-term GBP/USD technical trade levels.
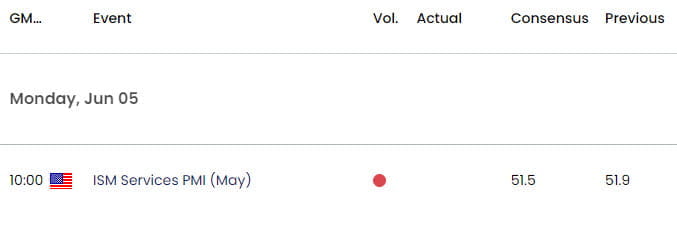
Key Economic Data Releases

Economic Calendar - latest economic developments and upcoming event risk.
Active Weekly Technical Charts
- US Dollar (DXY)
- Gold (XAU/USD)
- Crude Oil (WTI)
- Canadian Dollar (USD/CAD)
- S&P 500, Nasdaq, Dow Jones
- Euro (EUR/USD)
- Japanese Yen (USD/JPY)
- Australian Dollar (AUD/USD)
--- Written by Michael Boutros, Sr Technical Strategist with FOREX.com
Follow Michael on Twitter @MBForex


