Bitcoin
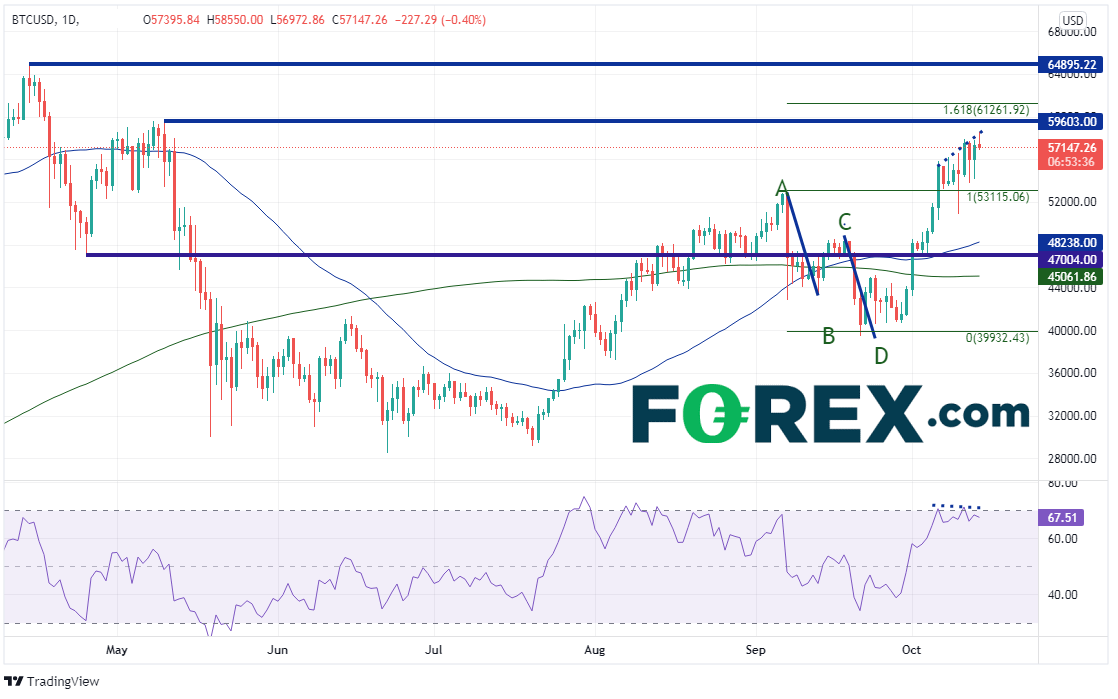
Bitcoin has been on a tear since the beginning of October (also the beginning of Q3) as traders used the month of September (also the end of Q2) to take profits. Bitcoin formed an AB=CD pullback before reversing and moving to its highest level since May 10th this week! The cryptocurrency is formed a shooting star on the daily timeframe on October 14th, indicating it may be ready for a pullback. The RSI is diverging from price as well. Horizontal resistance above is at the May 10th highs of 59,603, the 161.8% Fibonacci extension from the September 7th highs to the September 21st lows at 61,261.92 and finally the all-time highs from April at 64,895.22. If Bitcoin does correct, there is support below at the September 7th highs near 53,115.06, then a quick spike low from October 10th, down at 51,000. In addition, the 50-Day Moving Average is the next support level at 48,238.22.

Source: Tradingview, Stone X
Correlation Coefficient
However, if traders don’t have access to trade Bitcoin, they can still use the cryptocurrency to help them trade foreign exchange. Correlation is a word that is used to describe a relationship between two assets. The correlation coefficient describes how one asset moves in relation to the other. A correlation coefficient of +1.00 means that there is a perfect positive correlation and the 2 assets always move in the same direction. A correlation coefficient of -1.00 means that there is a perfect negative correlation and the 2 assets always move in opposite directions. A correlation coefficient of 0.00 means that there is no correlation at all between the 2 assets. Also, a correlation coefficient of +0.80 is considered to be a strong positive correlation between 2 assets. A correlation coefficient of -0.80 is considered to be a strong negative correlation. Correlations can, and often do, change over time.
BTC and FX correlation coefficients
Currently on some daily (longer-term) timeframes, Bitcoin has strong correlation coefficients with commodities, such as lumber (+0.84), RBOB Gasoline (+0.93) and soybeans (-0.87). Therefore, its no surprise that Bitcoin also has high correlations with some commodity currencies. Below are a few examples:
AUD/USD
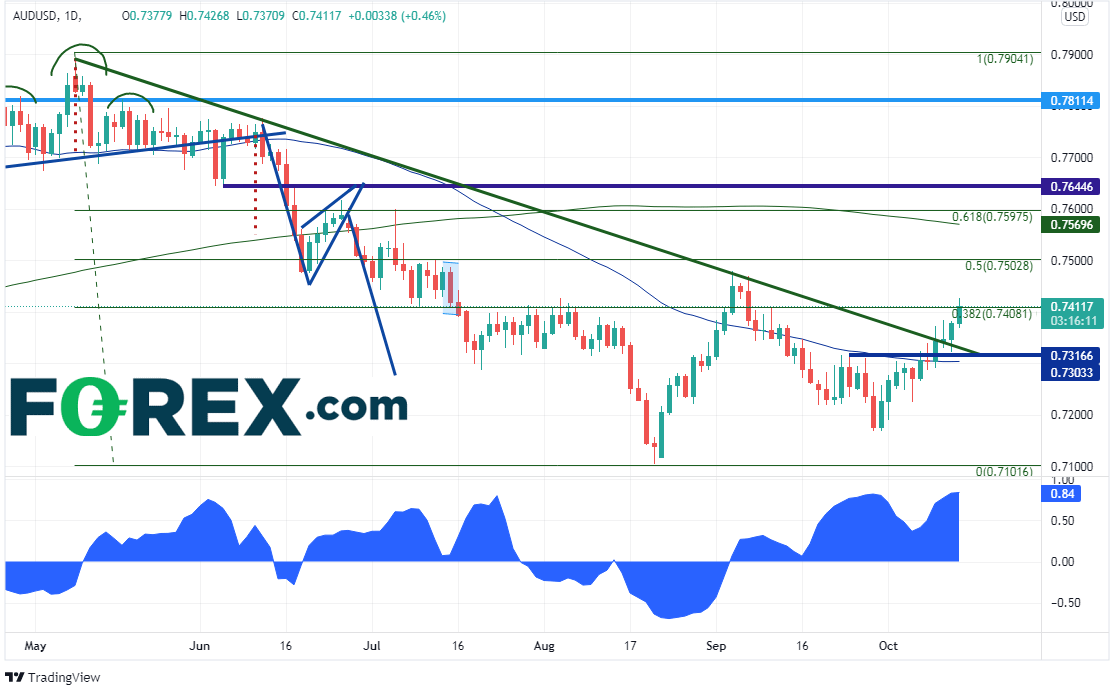
AUD/USD began moving higher on September 30th, the same time Bitcoin began moving higher off its recent lows. On its way off the lows of 0.7170, the pair moved through resistance at the 50-Day Moving Average, horizontal resistance, a downward sloping trendline dating back to May 10th, and the 38.2% Fibonacci retracement from the highs of May 10th to the lows of August 20th near 0.7408. The current correlation coefficient on the daily timeframe is +0.84. Therefore, if traders are looking for a directional trade in AUD/USD, they can use the price direction of Bitcoin as a tool to help them determine the direction AUD/USD may move next.

Source: Tradingview, Stone X
Trade AUD/USD now: Login or open a new account!
USD/CAD
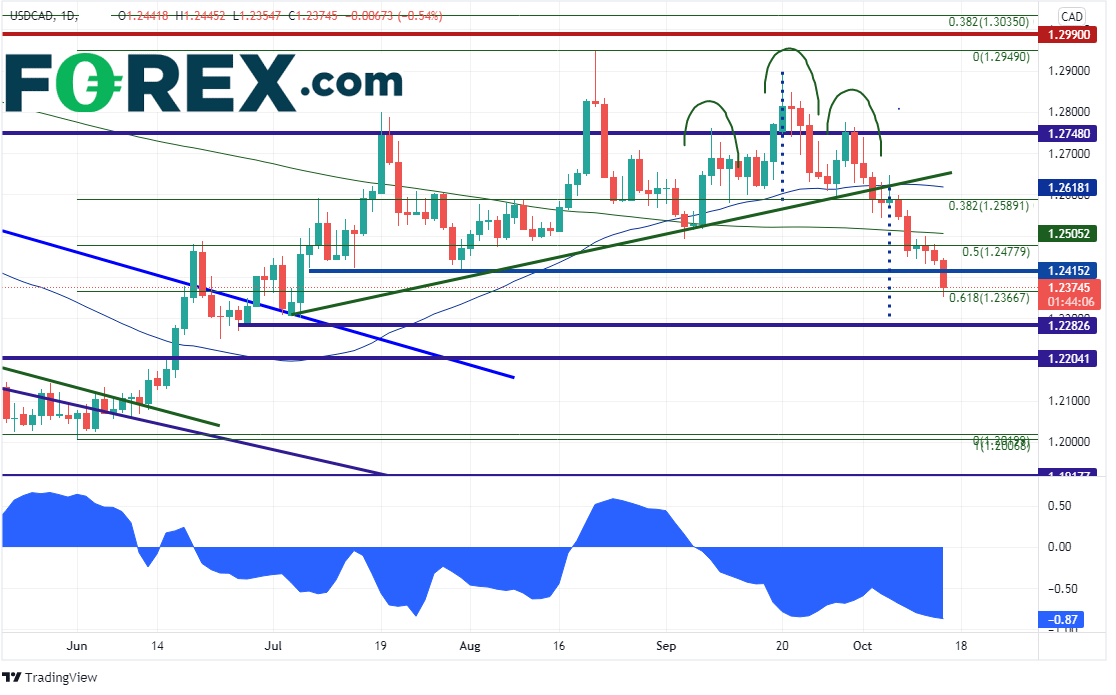
USD/CAD began moving lower during the day on September 20th, from a high of 1.2896. However, the pair began to pick up steam for the selloff on September 30th. On its move lower, the pair broke below an upward sloping neckline of a head and shoulders pattern, the 50-day and 200-Day Moving Averages, and the 38.2% Fibonacci retracement and the 50% retracement of the move from the June 1st lows to the August 20th highs. On October 14th, the pair also broke below horizontal support at 1.24152 and the 61.8% Fibonacci retracement of the previously mentioned timeframe at 1.23667. The current correlation coefficient on the daily timeframe is -0.87. Therefore, if traders are looking for a strong directional trade in USD/CAD, they can use the price direction of Bitcoin to help them! (Remember that a negative correlation means they move in opposite directions).

Source: Tradingview, Stone X
Your guide to the Canadian Dollar
Trade USD/CAD now: Login or open a new account!
USD/RUB
USD/RUB began moving lower in earnest after forming a high of 78.58 on April 6th. On May 6th the pair broke below a symmetrical triangle dating back to the pandemic highs of March 2020. USD/RUB continued to make lower highs after the breakdown and hasn’t closed above the 200-Day Moving Average since April 30th. USD/RUB hasn’t closed above the 50-Day Moving Average since August 26th. On October 14th, the pair traded to its lowest level since July 2020, taking out the lows of June 11th at 71.55. The current correlation coefficient on the daily timeframe is -0.87. Therefore, if traders are looking for a strong directional trade in USD/RUB, they can use the price direction of Bitcoin to help them!

Source: Tradingview, Stone X
Trade USD/RUB now: Login or open a new account!
Other examples
These are just a few examples of currency pairs which are highly correlated to Bitcoin on the daily timeframe. Others to consider are as follows:
- EUR/GBP (-0.90)
- CAD/JPY (+0.84)
- AUD/CHF (+0.87)
- AUD/JPY (+0.86)
- AUD/NZD (+0.86)
- EUR/AUD (-0.95)
- EUR/CAD (-0.89)
- EUR/CHF (-0.84)
- EUR/NOK(-0.89)
- GBP/AUD (-0.81)
- GBP/JPY(+0.82)
- EUR/RUB (-0.87)
Bitcoin can be an important asset for foreign exchange traders to have in their arsenal. The current correlation coefficient between Bitcoin and many currency pairs is strong right now. Therefore, fx traders can use the direction of Bitcoin to help them determine the possible direction of highly correlated FX pairs!
Learn more about forex trading opportunities.


