Australian Dollar Technical Outlook: AUD/USD Short-term Trade Levels
- Australian Dollar fails at resistance- reversal gathers pace
- AUD/USD plunge from uptrend resistance approaching uptrend support
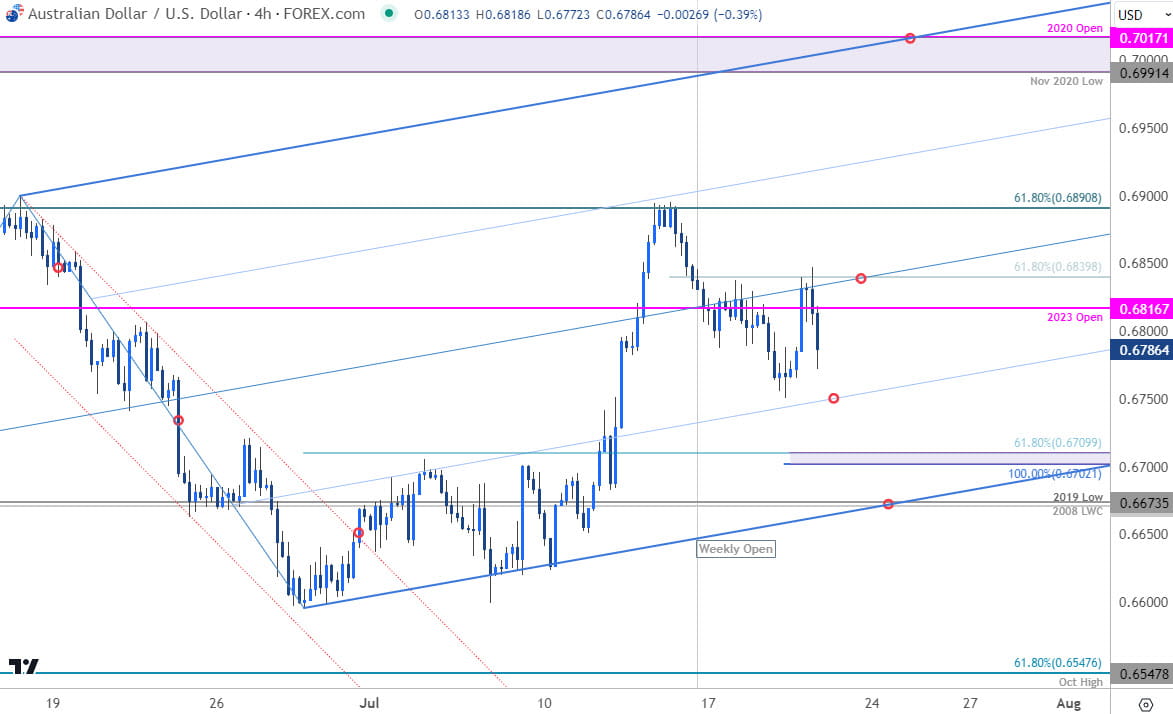
- Resistance 6840, 6890, 6991-7017– support ~6750s, 6702/10, 6670/73 (key)
The Australian Dollar is poised to snap a two-week winning streak with AUD/USD plunging more than 2% off the monthly highs. A weekly opening-range is set just below resistance and while the broader outlook remains constructive, the threat remains for further near-term losses within the uptrend. These are the updated targets and invalidation levels that matter on the AUD/USD short-term technical chart.
Review my latest Weekly Strategy Webinar for an in-depth breakdown of this AUD/USD technical setup and more. Join live on Monday’s at 8:30am EST.
Australian Dollar Price Chart – AUD/USD Daily

Chart Prepared by Michael Boutros, Sr. Technical Strategist; AUD/USD on TradingView
Technical Outlook: In last month’s Australian Dollar Short-term Outlook we highlighted that price had exhausted into Fibonacci resistance at the 61.8% retracement of the yearly range around 6890. We noted that, “From a trading standpoint, we’re looking for possible downside exhaustion on a move towards the median-line. Rallies should be capped by the yearly-open IF price is heading lower on this stretch- look for a larger reaction on a drive towards 6700 for guidance.”
Aussie plunged as low as 6600 before rebounding into the July open with price marking another rally, and failed attempt, to breach Fib resistance. AUD/USD is once again down more than 2% from this level with price firmly below the median-line.
Australian Dollar Price Chart – AUD/USD 240min

Chart Prepared by Michael Boutros, Sr. Technical Strategist; AUD/USD on TradingView
Notes: A closer look at Aussie price action shows AUD/USD trading within the confines of a modified pitchfork formation extending off the May lows with the median-line now highlighting near-term resistance around the 61.8% retracement of the recent decline at 6840. The weekly opening-range is preserved just below this threshold.
Initial support rests with the 25% parallel (currently ~6750s) backed by a key Fibonacci confluence at 6702/10 and the 2008 low-week close / 2019 low at 6670/73- both regions represent areas of interest for possible downside exhaustion / price inflection IF reached.
A topside breach of the weekly range would expose another test of June / July highs – ultimately a topside breach / close above 6890 is needed to mark resumption towards critical resistance at the November 2020 low / 2020 yearly open at 6690-7017.
Bottom line: The Australian Dollar remains vulnerable to further weakness within the confines of the uptrend- we’re on the lookout for a possible exhaustion low in the days ahead. From trading standpoint, rallies should be limited to the median-line IF price is heading lower here- look to reduce short-exposure / lower protective stops on a stretch towards 6700 IF reached. I’ll publish an updated Australian Dollar Weekly Forecast once we get further clarity on the longer-term AUD/USD technical trade levels.
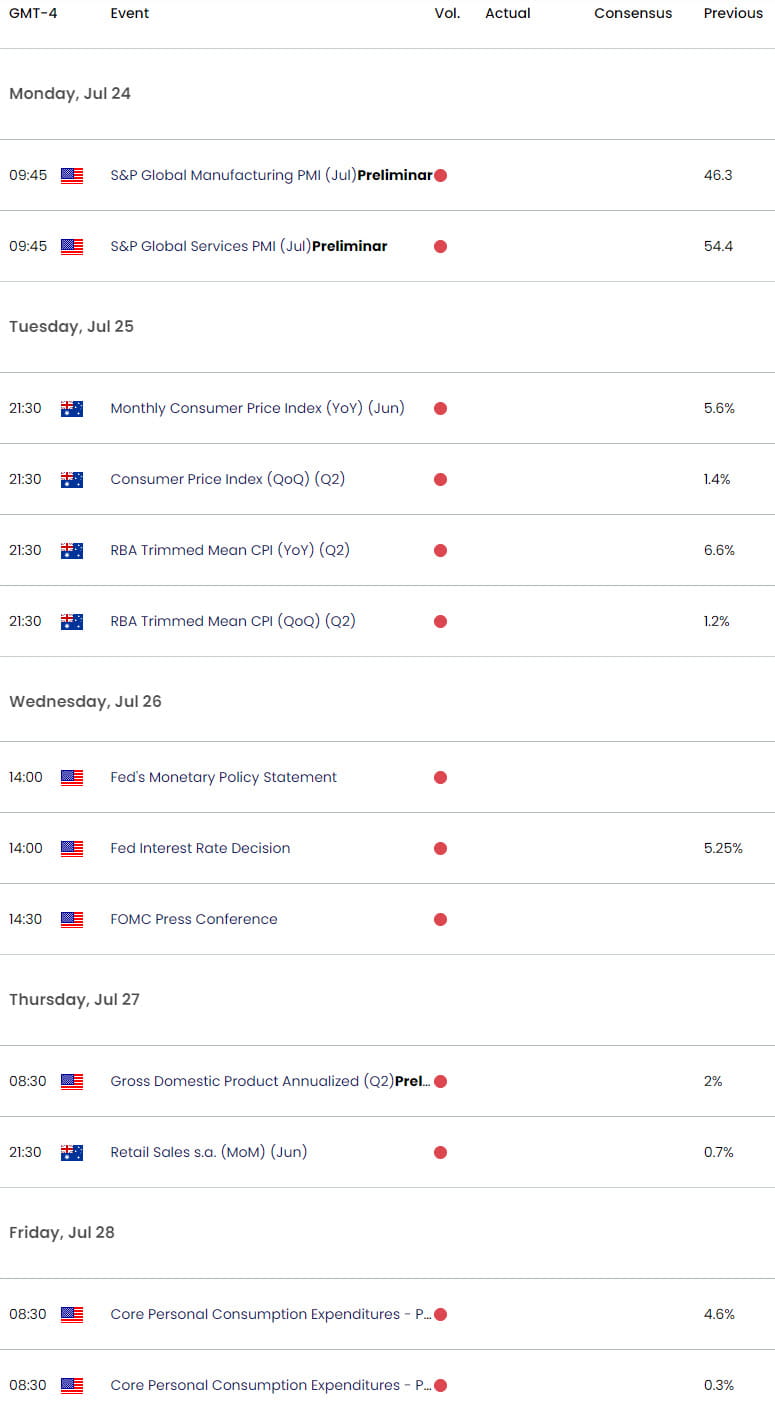
Key Economic Data Releases

Economic Calendar - latest economic developments and upcoming event risk.
Active Short-term Technical Charts
- Euro Short-term Outlook: EUR/USD Eight-day Rally at Resistance
- Japanese Yen Short-Term Technical Outlook: USD/JPY Free-Falling
- Gold Short-term Price Outlook: XAU/USD Moment of Truth at Key Support
- Canadian Dollar Short-term Outlook: USD/CAD Grinds at Resistance into Q3
- US Dollar Short-term Outlook: USD Bulls Eye July Breakout
Follow Michael on Twitter @MBForex


