Australian Dollar Technical Outlook: AUD/USD Short-term Trade Levels
- Australian Dollar plunges back below 2023-open after rallying nearly 7% off yearly low
- AUD/USD now eyeing initial uptrend support- risk for price inflection
- Resistance 6816, 6874/91 (key), ~6950s– support 6708/6731, ~6692, 6627 (key)
The Australian Dollar plunged more than 1.2% since the weekly-open with AUD/USD poised for a third consecutive daily loss. The move now exposes the first test for the monthly breakout and the focus is on possible exhaustion / price-inflection into uptrend support. These are the updated targets and invalidation levels that matter on the AUD/USD short-term technical chart.
Review my latest Weekly Strategy Webinar for an in-depth breakdown of this AUD/USD technical setup and more. Join live on Monday’s at 8:30am EST.
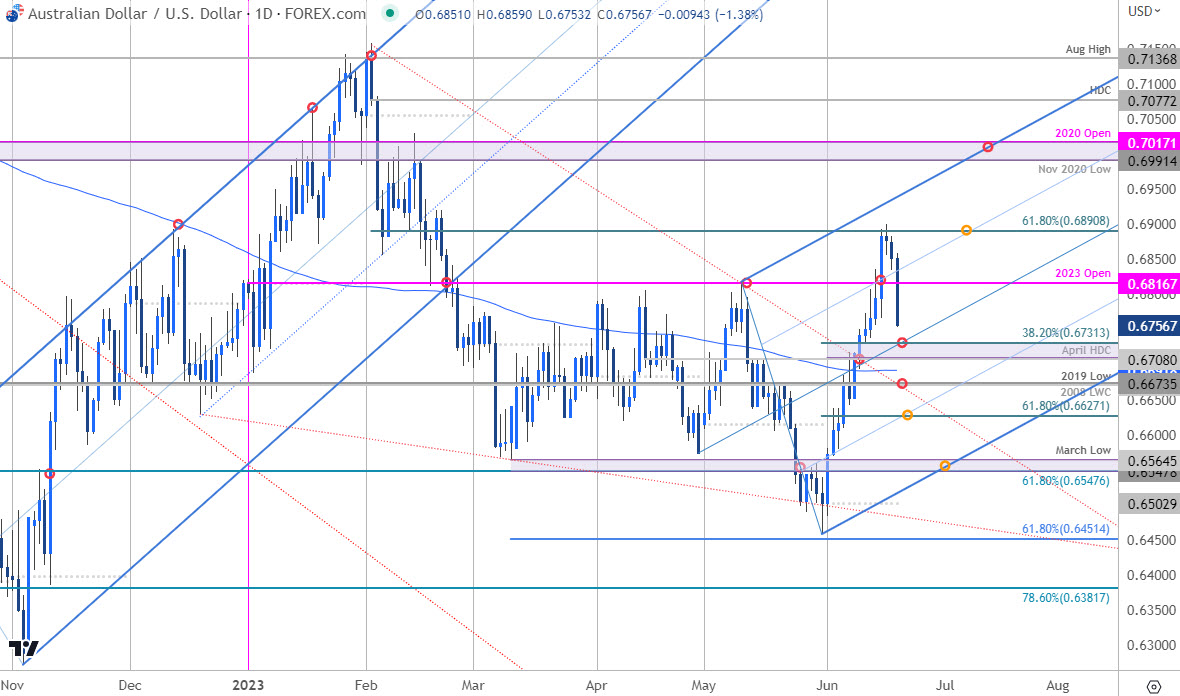
Australian Dollar Price Chart – AUD/USD Daily

Chart Prepared by Michael Boutros, Sr. Technical Strategist; AUD/USD on TradingView
Technical Outlook: In last month’s Australian Dollar short-term outlook we noted that AUD/USD was, “testing key support at the objective yearly range-lows – looking for possible exhaustion / inflection into this zone (watch the weekly close).” The support zone in focus was at 61.8% retracement of the 2022 advance, the October high and the yearly opening-range lows near 6547/65. An intra-week plunge turned just pips from the 61.8% extension of the February decline at 6451 (low registered at 6458) with Aussie staging a rally of more than 6.8% off that low.
An eleven-day stretch cleared yearly downtrend resistance (red) and was interrupted by just one-day until last week when Aussie was abruptly halted at the 61.8% Fibonacci retracement of the yearly-range near 6891. A three-day pullback has now taken back more than 2% and the immediate focus is possible downside exhaustion into initial support- just lower.
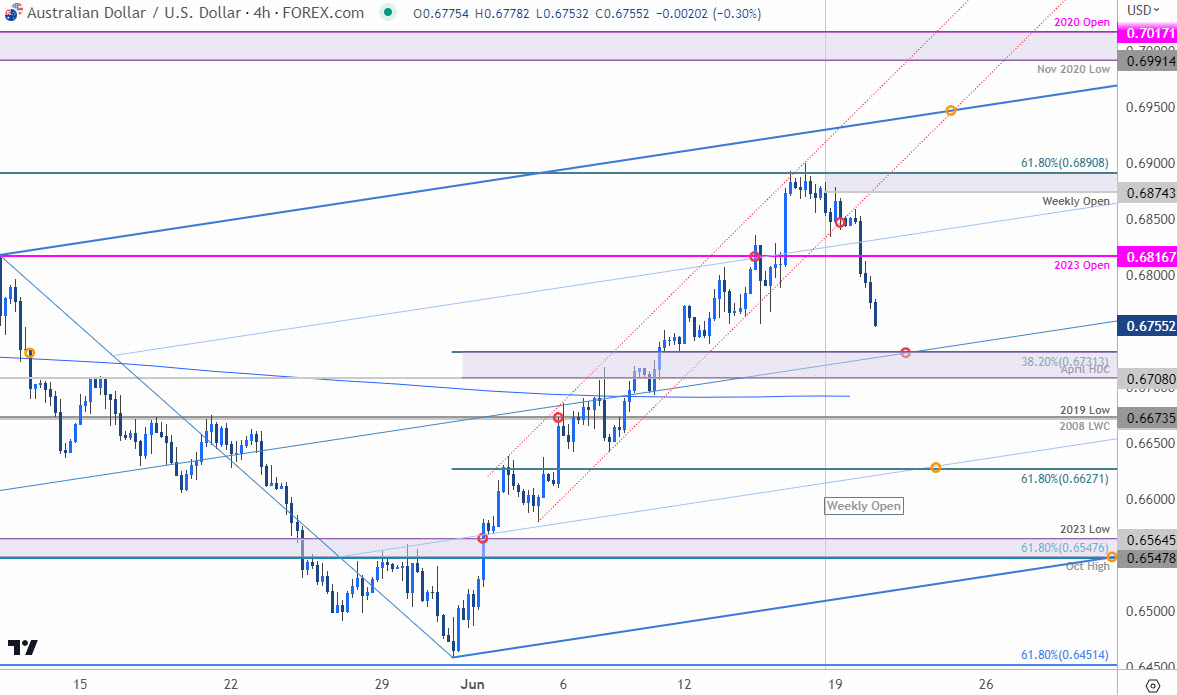
Australian Dollar Price Chart – AUD/USD 240min

Chart Prepared by Michael Boutros, Sr. Technical Strategist; AUD/USD on TradingView
Notes: A closer look at Aussie price action shows AUD/USD trading within the confines of an ascending pitchfork formation extending off the April / May lows with the median-line now highlighting key near-term support at 6708/31- a region defined by the April high-day close and the 38.2% retracement of the monthly advance.
Note that the 200-day moving average rests just lower near ~6692 – both levels of interest for possible downside exhaustion / price inflection. A break / close below this threshold would suggest a larger correction is underway towards 6673 and the 61.8% retracement of the recent advance at 6627- look for a larger reaction there IF reached.
Yearly-open resistance stands at 6816 backed by the weekly-open / 61.8% retracement at 6874/91- a breach / close above this level is needed to mark uptrend resumption towards the highlighted slope confluence near ~6950s and the November 2020 low / 2020 open at 6991-7017.
Bottom line: Despite a yearly-range of nearly 10%, Aussie is now less than 0.9% from the 2023 yearly open- this is still a slug fest. In the near-term, the AUD/USD rally has exhausted into Fibonacci resistance- just ahead of the uptrend. From a trading standpoint, we’re looking for possible downside exhaustion on a move towards the median-line. Rallies should be capped by the yearly-open IF price is heading lower on this stretch- look for a larger reaction on a drive towards 6700 for guidance. Review my latest Australian Dollar weekly technical forecast for a closer look at the longer-term AUD/USD trade levels.
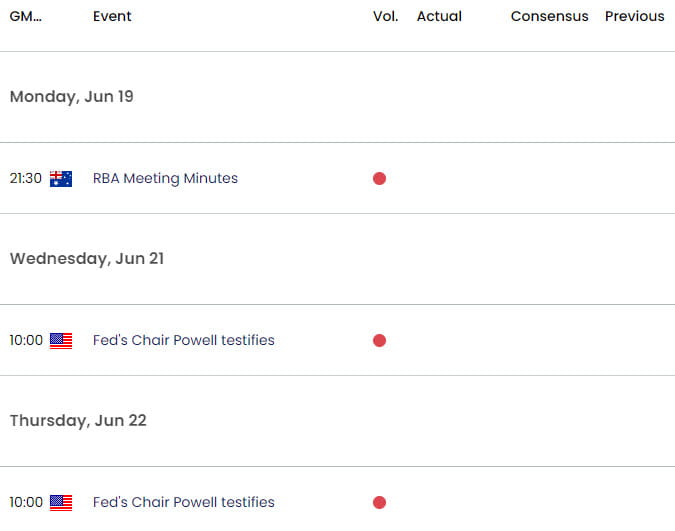
Key Economic Data Releases

Economic Calendar - latest economic developments and upcoming event risk.
Active Short-term Technical Charts
- Gold Short-term Price Outlook: XAU/USD Breakout Setup- FOMC on Tap
- Japanese Yen Short-Term Outlook: USD/JPY Eyes Breakout on FOMC / BoJ
- Canadian Dollar Short-term Outlook: USD/CAD Plunge Halted at Support
- British Pound Short-Term Outlook: GBP/USD Coils Above Uptrend Support
- Euro Short-term Outlook: EUR/USD Yearly-Open Support Pivot in Play
- US Dollar Short-term Outlook: USD Rips into Make-or-Break Resistance
--- Written by Michael Boutros, Sr Technical Strategist with FOREX.com
Follow Michael on Twitter @MBForex


