Australian Technical Forecast: AUD/USD Weekly Trade Levels
- Australian Dollar coil continues – contractionary range below key resistance pivot
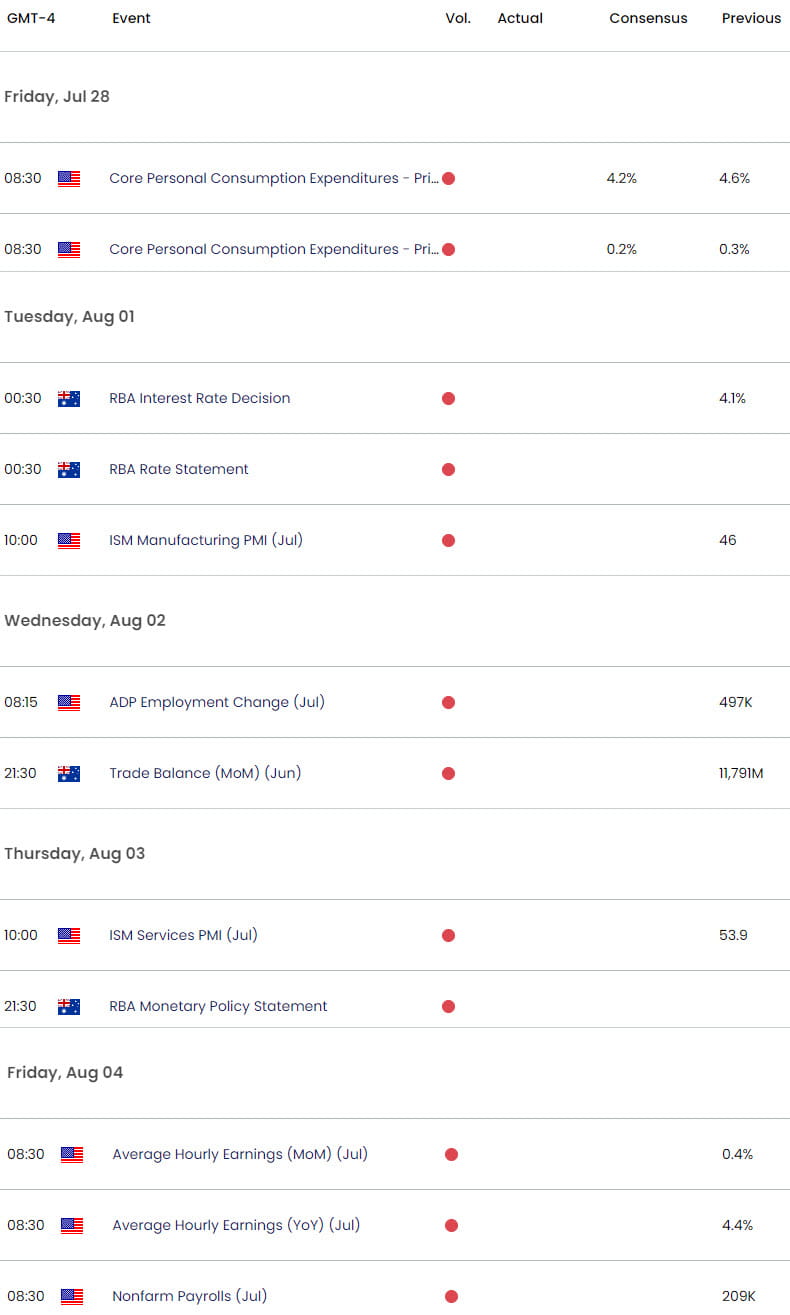
- AUD/USD trading at yearly moving average - Core PCE, RBA, NFPs on tap into August
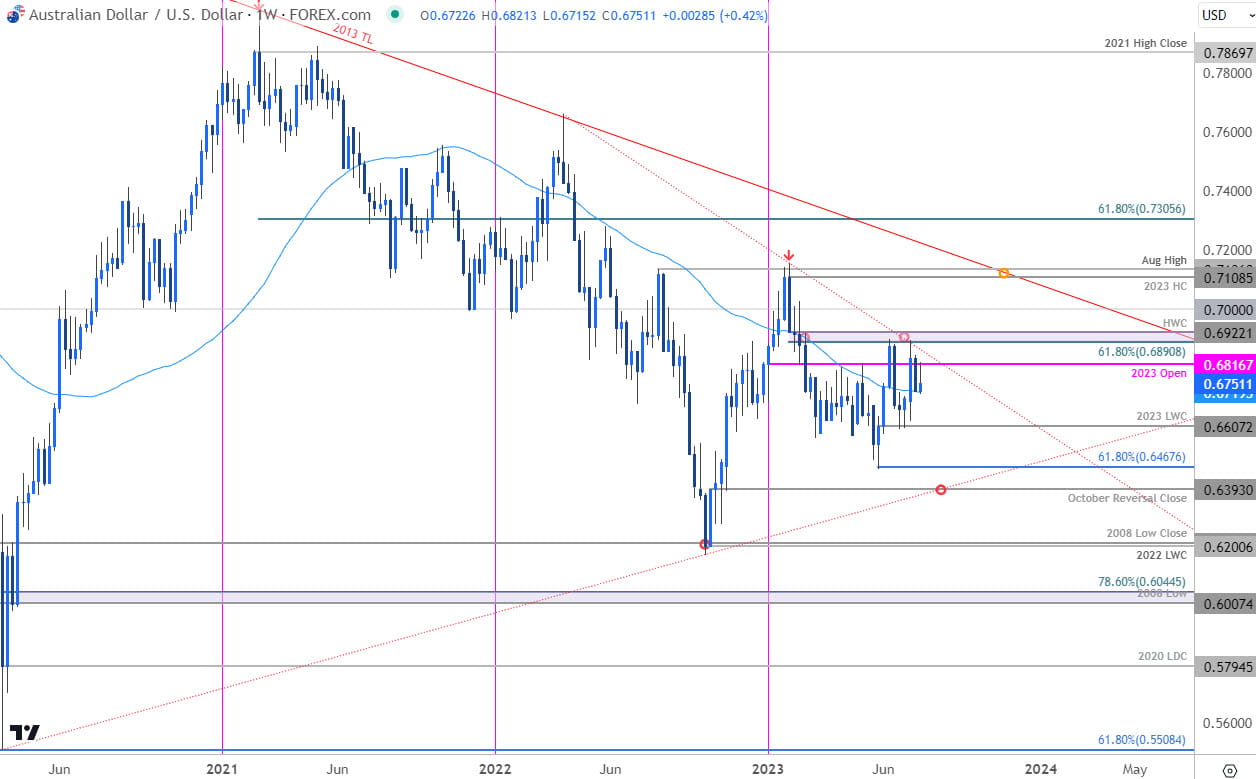
- Resistance 6816, 6890-6922 (key), 7000– support ~6719, 6607 (key), 6467
The Australian Dollar has been trading within a well-defined range for months now with AUD/USD now holding just below yearly-open resistance. The battle lines are drawn heading into August with major event-risk on tap next week- we’re on breakout watch. These are the updated targets and invalidation levels that matter on the AUD/USD weekly technical chart into the third quarter.
Review my latest Weekly Strategy Webinar for an in-depth breakdown of this Aussie setup and more. Join live on Monday’s at 8:30am EST.
Australian Dollar Price Chart – AUD/USD Weekly

Chart Prepared by Michael Boutros, Sr. Technical Strategist; AUD/USD on TradingView
Technical Outlook: In last month’s Australian Dollar Technical Forecast we noted that AUD/USD had turned from, “confluent resistance at 6890-6922- a region defined by the 61.8% Fibonacci retracement pf the yearly range and the objective high-week close.” The pullback was testing support at the 2023 low-week close around 6607 and our focus was on a breakout of this range. Nearly a month later, and that same range is preserved with both extremes being tested over the past few weeks.
Initial support now eyed with the 52-week moving average (~6719) backed by 6607- a break / close below this threshold is needed to mark resumption of the broader downtrend towards the 61.8% extension of the decline off the yearly highs at 6467 and the 2022 October reversal-close at 6393 (look for a larger reaction there IF reached).
Yearly-open resistance remains at 6816 with a breach / close above 6922 needed to validate a larger breakout towards the 70-handle and the next major pivot zone 7108/14- a region defined by the yearly high-close and the August swing highs.
Bottom line: Aussie remains within the confines of a massive multi-month consolidation formation with price faltering into resistance again this month. From at trading standpoint, the medium-term threat remains lower while below the 2022 trendline with the immediate focus on a breakout of the 6607-6816 range for guidance. Keep in mind we head into a new month next week with the RBA interest rate decision and US non-farm payrolls on tap – stay nimble here. Review my latest Australian Dollar Short-term Outlook for a closer look at the near-term AUD/USD technical trade levels.
Key Economic Data Releases

Economic Calendar - latest economic developments and upcoming event risk.
Active Weekly Technical Charts
- US Dollar (DXY)
- Crude Oil (WTI)
- Gold (XAU/USD)
- Canadian Dollar (USD/CAD)
- Euro (EUR/USD)
- British Pound (GBP/USD)
--- Written by Michael Boutros, Sr Technical Strategist with FOREX.com
Follow Michael on Twitter @MBForex


