Market Summary:
- Moody’s ratings agency downgraded their credit rating for the US to negative from stable, due to large fiscal deficits and weakening debt affordability
- Market pricing in early Asian trade has taken the downgrade within its stride
- The Nasdaq 100 has posted gains over the past 18 Mondays (and the S&P 500 have posted gains 17 of the past 18). With no immediate explanation as to why, we now wait to see if it can add to the impressive winning streak
- Joe Biden says he wants the US and China to re-establish military ties, ahead of their face to face meeting on Wednesday
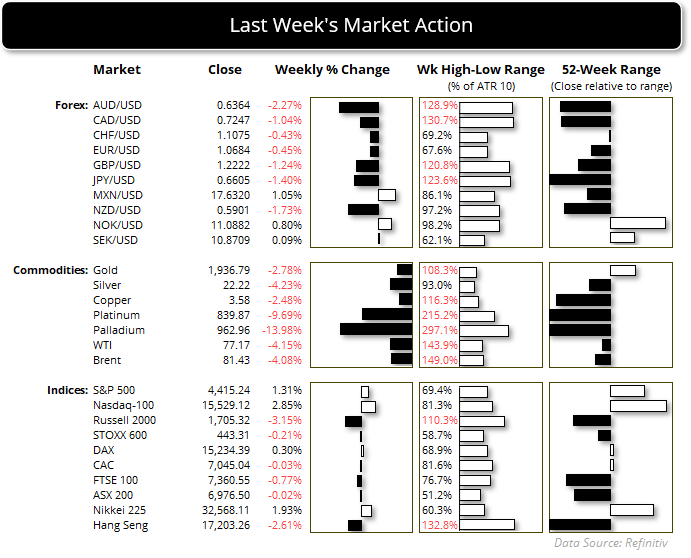
- The Australian dollar was the weakest forex major last week, following a less-hawkish than expected RBA hike. The Aussie also fell for five consecutive days and closed beneath 64c
- WTI crude oil enjoyed its best day of the week on Friday after finding support at $75 (one of my bearish targets). It also formed a 3-day bullish reversal pattern called a morning star formation. As it has now fallen for three weeks and in a relatively straight line, I’m happy to step aside and stay flat.
- Gold fell for a second consecutive week and closed beneath the September high, although the 38.2% Fibonacci ratio between the October high and low is acting as support.

Events in focus (AEDT):
- Publish holiday in Singapore (Diwali)
- 08:30 – New Zealand Performance of Services index
- 10:50 – Japan producer prices
- 17:00 – Japan machine tool orders
- 19:00 – China new loans, outstanding loan growth, total social financing, M2 money supply
- 22:55 – BOE Breeden speaks
ASX 200 at a glance:
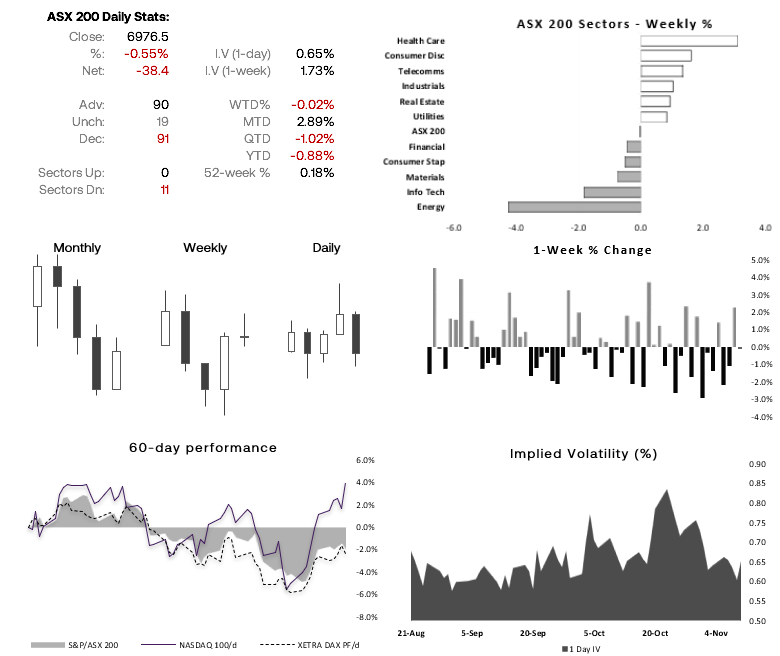
- The ASX 200 posted a minor loss last week, and spent most of the week meandering around 7,000
- SPI futures and Wall Street’s gains on Friday suggest a positive open for the ASX cash index today
- Yet its indecision around the 7,000 area make it a difficult market to have a bias on, particularly as the daily ranges have been smaller than usual
- Therefore, my bias is neutral until volatility returns and momentum tips its hand

S&P 500 technical analysis (daily chart):
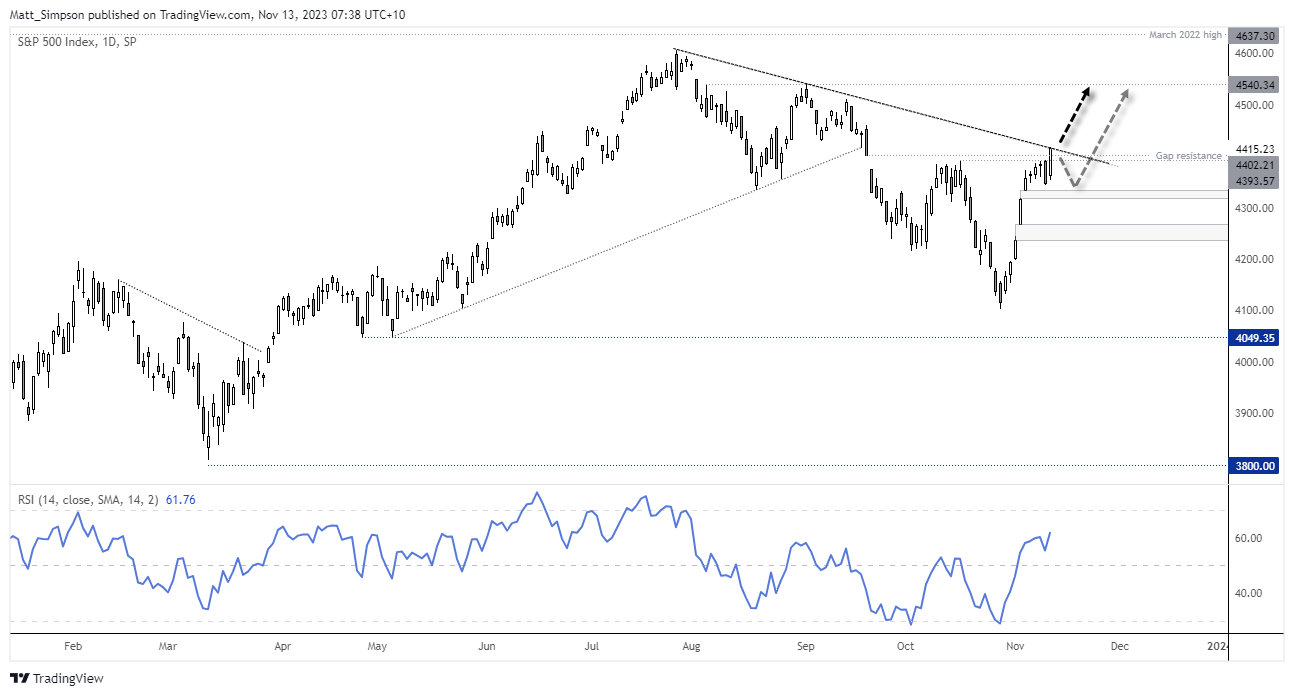
The S&P 500 has risen over 7% since the late-October low, and in it has done so in a relatively straight line. There was a slight consolidation last week, although Friday’s strong bullish candle suggests its ready for its next leg higher. Whilst the S&P 500 closed above gap resistance, the trendline capped its upside. Therefore, bulls can either with for a break above Friday’s high to assume bullish continuation, or wait to see if prices pull back and respect a support level before seeking to buy the dip (in anticipation of a breakout).

AUD/USD technical analysis (daily chart):
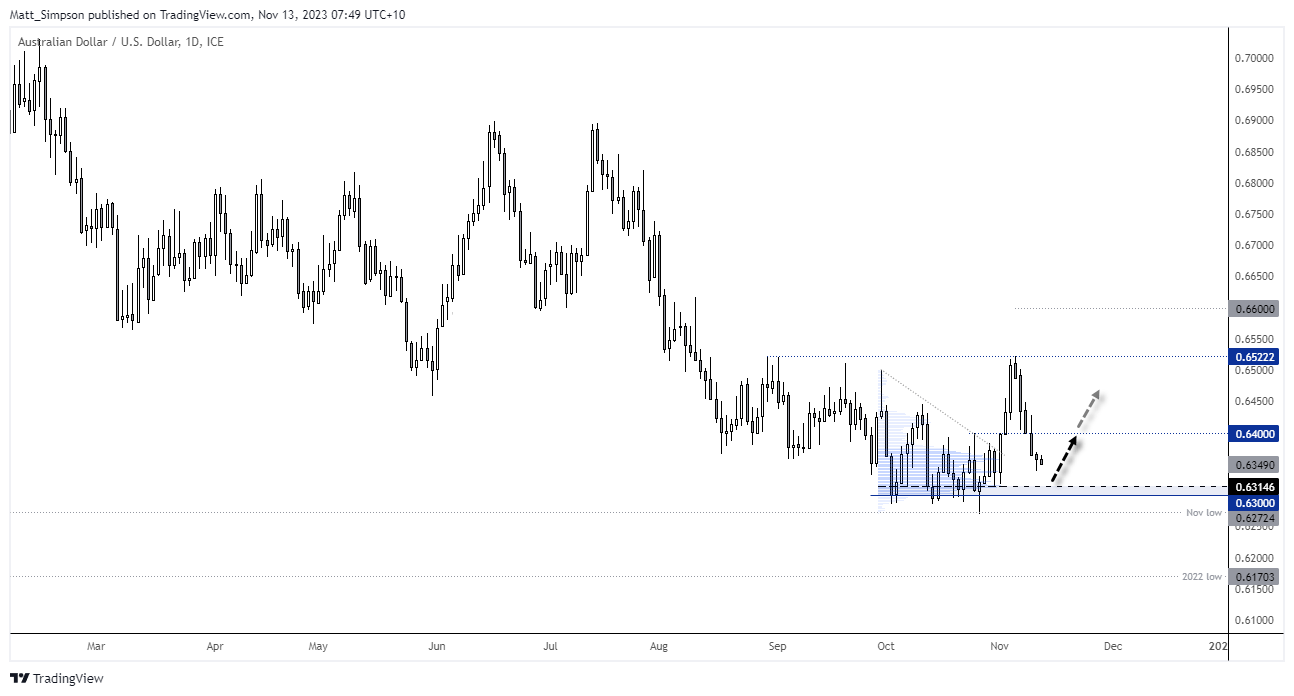
This is on the scrappy side, but AUD/USD’s ability to hold above the 63c area despite data and headlines suggesting it should have broken lower already should not be ignored. A small bullish hammer formed on Friday, and as it has fallen for five consecutive days then odds suggest we maybe nearing an up day. Any pullbacks towards 63c / 0.6314 (the most traded prices during the prior consolidation) will pique my bullish interest for a initial move to 64c. A break above which brings 0.6450 into focus.

View the full economic calendar
-- Written by Matt Simpson
Follow Matt on Twitter @cLeverEdge


