Finally - an interesting employment report arrives for Australia, which could be good for traders but less so for the economy. We have three ‘misses’ with employment change and the participation rate below expectations and the unemployment rate above.

The standout figure is employment falling -14.6k, which is its worst since July and below its 3 and 12-month averages of 38.1k and 31.1k respectively. It’s unlikely to derail the RBA from another 25bp hike in February (especially with inflation continuing to rise) but the RBA will keep a close eye on employment change and unemployment to see if it is the beginning of a trend.

For now, the weak lead form Wall Street - which toppled commodity FX overnight – today’s employment figures are another reason to sell the Aussie, following its rally of the past three months.
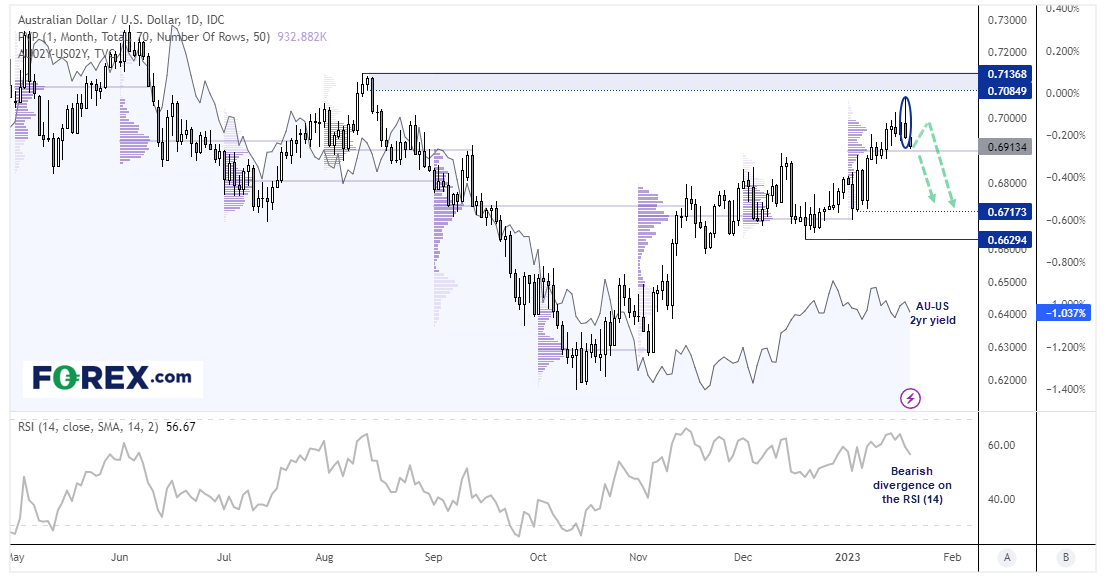
AUD/USD daily chart:
There’s a few things to cover here but it al ties in to a pullback for the Aussie (in my humble opinion). It’s had a better-than-expected rally since the October low, which has stalled at the August highs as of yesterday, with a bearish engulfing hammer. The fact the candle high did not even touch the resistance zone and failed to hold above 0.7000 hints at a potential top. And the fact that we have a 2-month bearish divergence with the RSI (14) and that the AU-US 2yr yield spread remains relatively low compared to the Aussie’s rally provides more conviction for a pullback in my view.

However, notice that today’s lows area holding above last week’s VPOC (volume point of control) which may continue to provide some support for now. Ultimately my bias is bearish beneath yesterday’s high, and would consider fading into rallied within yesterday’s candle. Also keep an eye on the S&P 500 as the Aussie is tracking it quite well at the moment, so we would like to see the S&P also roll over as outlined in this TradingView article.
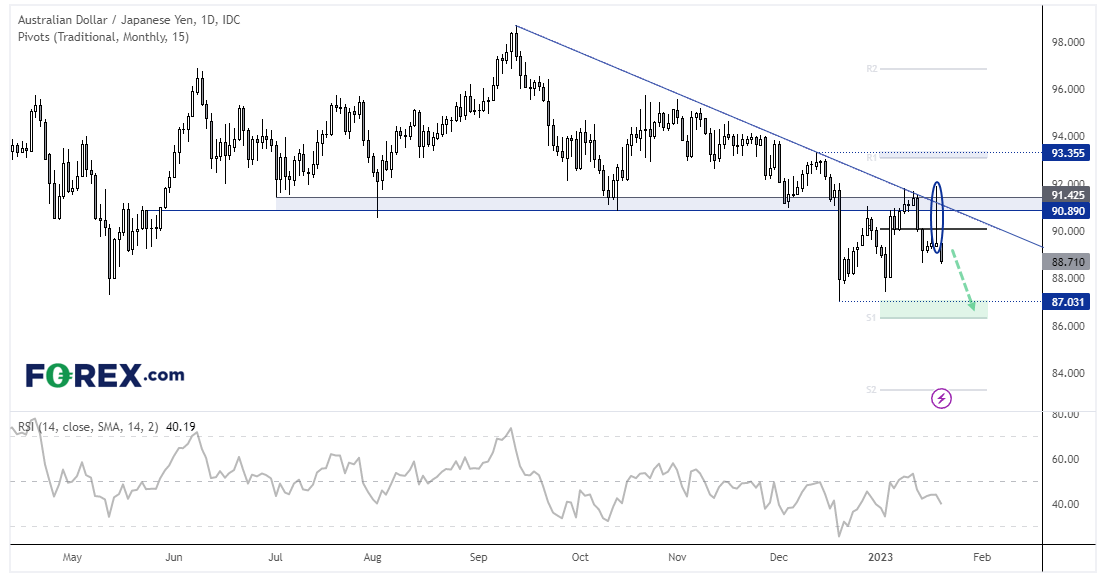
AUD/JPY daily chart:
We noted yesterday that AUD/JPY was trying to close above 92.0 yesterday following the BOJ meeting – but alas it was not to be. Weak US data saw money flow back into the yen and crush AUD, USD and CAD pairs and AUD/JPY to hand back all of its BOJ gains.
The long bearish Pinbar – which failed to hold above an important resistance cluster is also important as it shows a potential swing high. Should sentiment remain risk-off overall, then we suspect AUD/JPY could be headed for the lows around 0.87.


