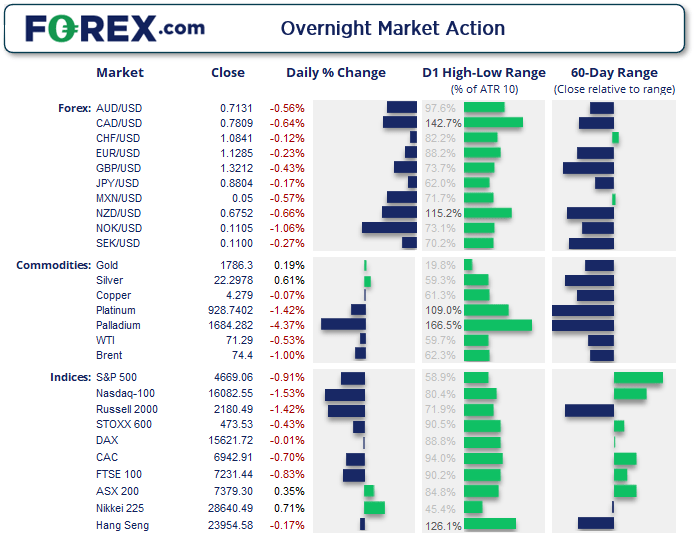
It was a weak close on Wall Street with all three large cap indices closing lower. The Nasdaq fell -1% and the DJI and S&P 500 were around -0.9% lower. Investors are likely squaring up their books ahead of the Fed’s final meeting of the year tomorrow where they may announce a faster pace of tapering.

DXY coiling within a (potentially) bullish triangle
The US dollar index continues to coil in a triangle pattern on the daily chart whilst holding above the 20-day eMA. Given the bullish daily trend the bias is for a bullish breakout, but we may need to wait for a conclusion of the Fed’s meeting on Wednesday for a trigger.
The UK is ow reporting 200k Omicron cases per day and have confirmed the first known death from it globally. The British pound gave back earlier gains to close around -0.4% against the US dollar. GBP/AUD printed a bearish hammer after a false break above the October high. The FTSE 100 fell to a 5-day low and closed beneath its 20-day eMA but just above its 50-day.
EUR/AUD has snapped a 5-day losing streak with a bullish candle, raising the prospects for a swing low to have formed just above 1.5700.
WTI is holding above $70 and probing trend resistance
How to start oil trading
OPEC raised their oil demand forecast for Q1 2022 and stated that the Omicron variant may only have a mild and brief impact. His is in contrast to the warning from WHO (World Health Organisation) who warn that the new covid variant poses a significant global risk. WTI is trading just below $73 in a tight range and has probed trend resistance. At this stage it is unclear whether prices will take another dip lower beneath $70 or break above the trendline, but we are leaning slightly towards a bullish breakout due to the solid bounce Above the August low last week which began with a bullish hammer. A break above 73.34 invalidates trend resistance and assumes bullish continuation.
Palladium closed below $1700 for the first time since March 2020 and is just a trading day away from testing $1600 looking at its ATR (average true range). Gold drifted to a 3-day high and met resistance at its 20-day eMA. Yet with the 200-day eMA sat around $1800 it may prove to be a tough level to crack initially.
ASX 200 Market Internals:

The ASX 200 has rallied 3.8% since last Monday’s low but has found resistance at the trendline form the August high. Given the magnitude of the rally this seems like a healthy pause before a potential breakout, so from here we’re looking for prices to hold above 7300 ahead of a break above 7440.
ASX 200: 7379.3 (0.35%), 13 December 2021
- Energy (1.68%) was the strongest sector and Financials (-0.27%) was the weakest
- 5 out of the 11 sectors closed lower
- 4 out of the 11 sectors outperformed the index
- 110 (55.00%) stocks advanced, 82 (41.00%) stocks declined
- 58.5% of stocks closed above their 200-day average
- 48.5% of stocks closed above their 50-day average
- 53% of stocks closed above their 20-day average
Outperformers:
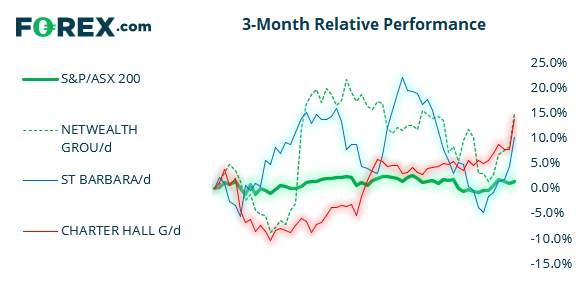
- + 6.2% - Netwealth Group Ltd (NWL.AX)
- + 5.69% - St Barbara Ltd (SBM.AX)
- + 5.62% - Charter Hall Group (CHC.AX)
Underperformers:
- -3.64% - Insurance Australia Group Ltd (IAG.AX)
- -3.38% - NIB Holdings Ltd (NHF.AX)
- -3.32% - Pointsbet Holdings Ltd (PBH.AX)
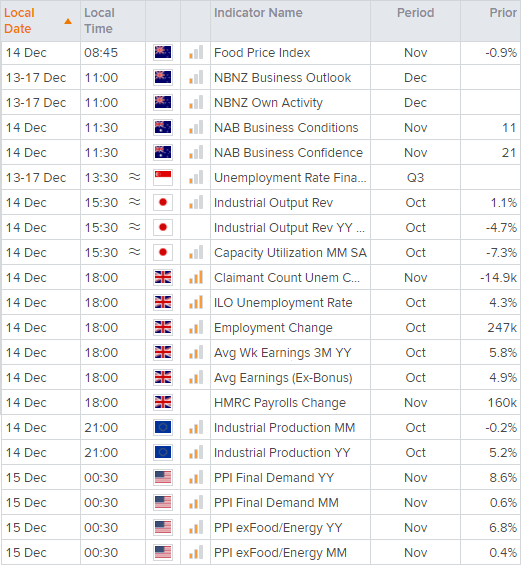
Up Next (Times in AEDT)

How to trade with FOREX.com
Follow these easy steps to start trading with FOREX.com today:
- Open a Forex.com account, or log in if you’re already a customer.
- Search for the pair you want to trade in our award-winning platform.
- Choose your position and size, and your stop and limit levels.
- Place the trade.


