EUR/GBP rises ahead of inflation data
- Eurozone inflation is expected to cool to 8.2% YoY
- German, Spain & France inflation were hotter than forecast
- EUR/GBP looks towards 0.89
EUR/GBP is falling for a third straight day as investors digest the latest comments from BoE Governor Andrew Bailey and look ahead to eurozone inflation data.
Eurozone inflation is expected to cool to 8.2% YoY in February, down from 8.6% in January. Core inflation is expected to hold steady at 5.3% after unexpectedly taking higher in the previous month.
The data comes after German French, and Spanish inflation unexpectedly increased in February. The hotter-than-forecast inflation piles pressure on the ECB to continue hiking interest rates aggressively. A 50 basis point rate hike in March is looking increasingly likely.
The minutes of the February ECB meeting will be released and will be scrutinized for clues about the inflation outlook and the future path of monetary policy. ECB’s Christine Lagarde is also due to speak.
Meanwhile, the pound is struggling as Brexit optimism fades and after BoE Governor Andrew Bailey raised questions over whether the BoE will hike rates again in March. BoE chief economist Huw Pill is due to speak later.
Where next for EUR/GBP?
EURGBP has rebounded off the 100 sma, rising back into the multi-month rising channel and above the 50sma. This, combined with the RSI above 50 keeps buyers hopeful of further upside.
Buyers will look to take out resistance at 0.89, yesterday’s high, to extend gains towards 0.8930, the February 17 high, creating a higher high. Beyond here, 0.8980 comes into focus.
On the flipside, sellers could look for a break below the 50 sma at 0.8835 and the rising trendline support at 0.88. A break below the 100 sma at 0.8750 and this week’s low is needed to create a lower low and bring 0.8720, the 2023 low into focus.

Nasdaq breaks below the 200 sma ahead of jobless claims data
- Hawkish Fed commentary
- US jobless claims expected to remain 200k
- Nasdaq below 200 sma
US stocks ended the session lower yesterday, and futures are falling again this morning as investors fret over interest rates for longer.
Hawkish Fed bets were boosted by Fed Atlanta President Raphael Bostic, who said that interest rates need to rise to 5.25-5.5% and remain there until 2024; Fed President Kashkari also highlighted that inflation in the US is still very high, and the risk was under tightening rather than overtightening.
US ISM manufacturing data also fueled bets of higher rates after the prices paid sub-component rose to 51.3 in February, up from 44.5.
Looking ahead, US jobless claims will be in focus and are expected to highlight tightness in the labour market. Initial claims are forecast to remain under 200k at 195k, up modestly from 192k last week.
Where next for the Nasdaq?
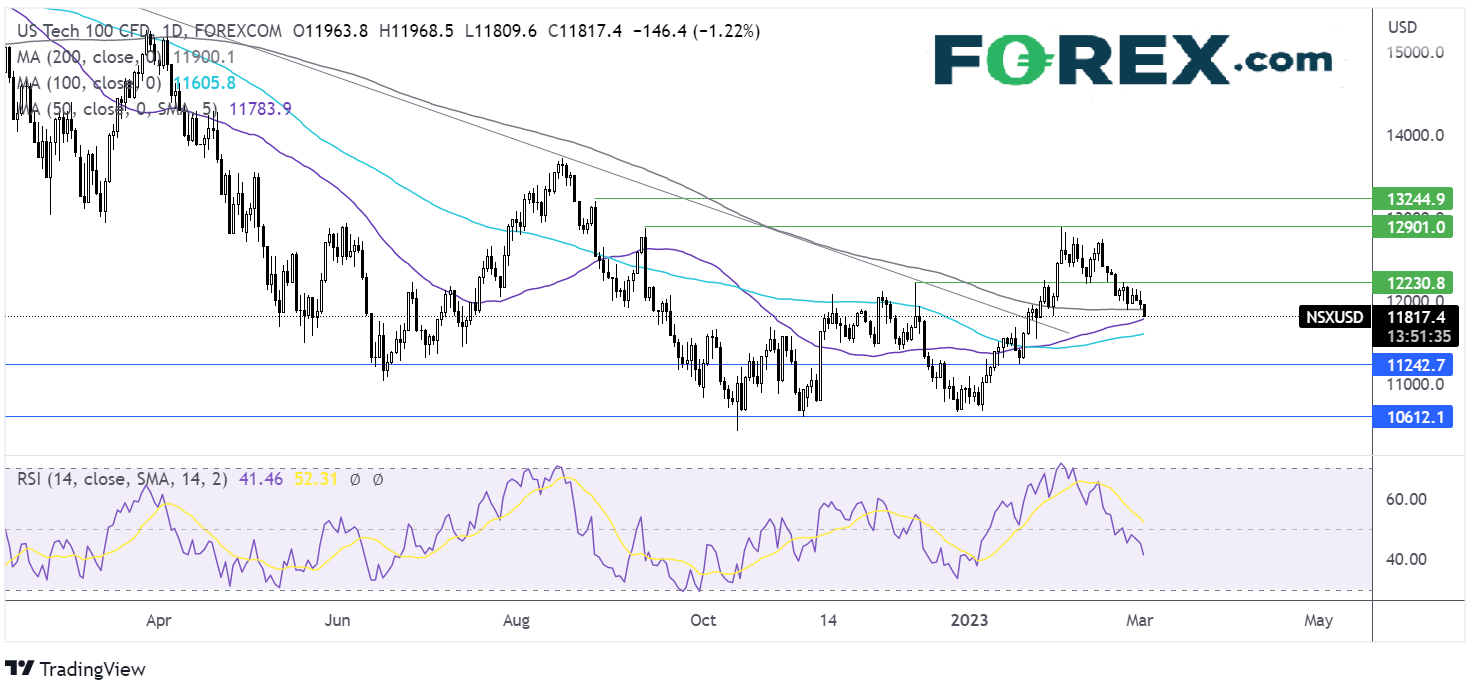
The Nasdaq has been trending lower from 12900 reached at the start of the month, taking out support at 12215 and the 200 sma at 11900. This along with the RSI below 50 keeps sellers hopeful of further downside.
Sellers will look to test the 50 sma at 11780, with a break below here exposing the 100 sma at 11600, before bringing the 11200 support into focus.


