
Gold, XAU/USD Talking Points:
- Gold prices have seen the bullish trend cool after a historic two-week rally.
- Gold was showing deep oversold conditions in early-October as RSI pushed below the 20-level, but just a couple of weeks later RSI had already moved into an overbought state, highlighting a fast theme of re-pricing in the market. But the big question now is whether it can continue and for low long?
- Tomorrow brings inflation data out of the US in the form of PCE, and next week is big for US markets with both the FOMC rate decision on Wednesday and NFP on Friday.
- I’ll be discussing these themes in-depth in the weekly webinar on Tuesday at 1PM ET. It’s free for all to register: Click here to register.
Gold prices have made a fast move in the month of October, but that might be a bit of an understatement. Gold prices have just put in their second-strongest two week-stretch in more than 20 years. The only other episode of a larger move building over two weeks was in July of 2020 as the monetary cannons were firing at full blast in response to Covid shutdowns. That run eventually led to a test of the $2k level, at which point the trend began to stumble and then soon after started to reverse.
There’s been two other tests at that $2k level since then and neither has been able to extend. Both came along with some geopolitical or economic strife as the test in 2022 took place just after Russia invaded Ukraine, and the test in April of this year showed up as regional banks in the US began to tremble due to interest rate risk triggered by continually rising rates.
Last week saw gold make a fast move at that $2k level but bulls fell a bit short, with the high printing at $1,997.23. And as of this writing price continues to hover ominously close to that level without it having come into play just yet. From the below monthly chart we can see how this dynamic has played out since the pandemic came into the picture in 2020, leading to the breakout and then multi-year range in gold prices.
Gold Weekly Price Chart
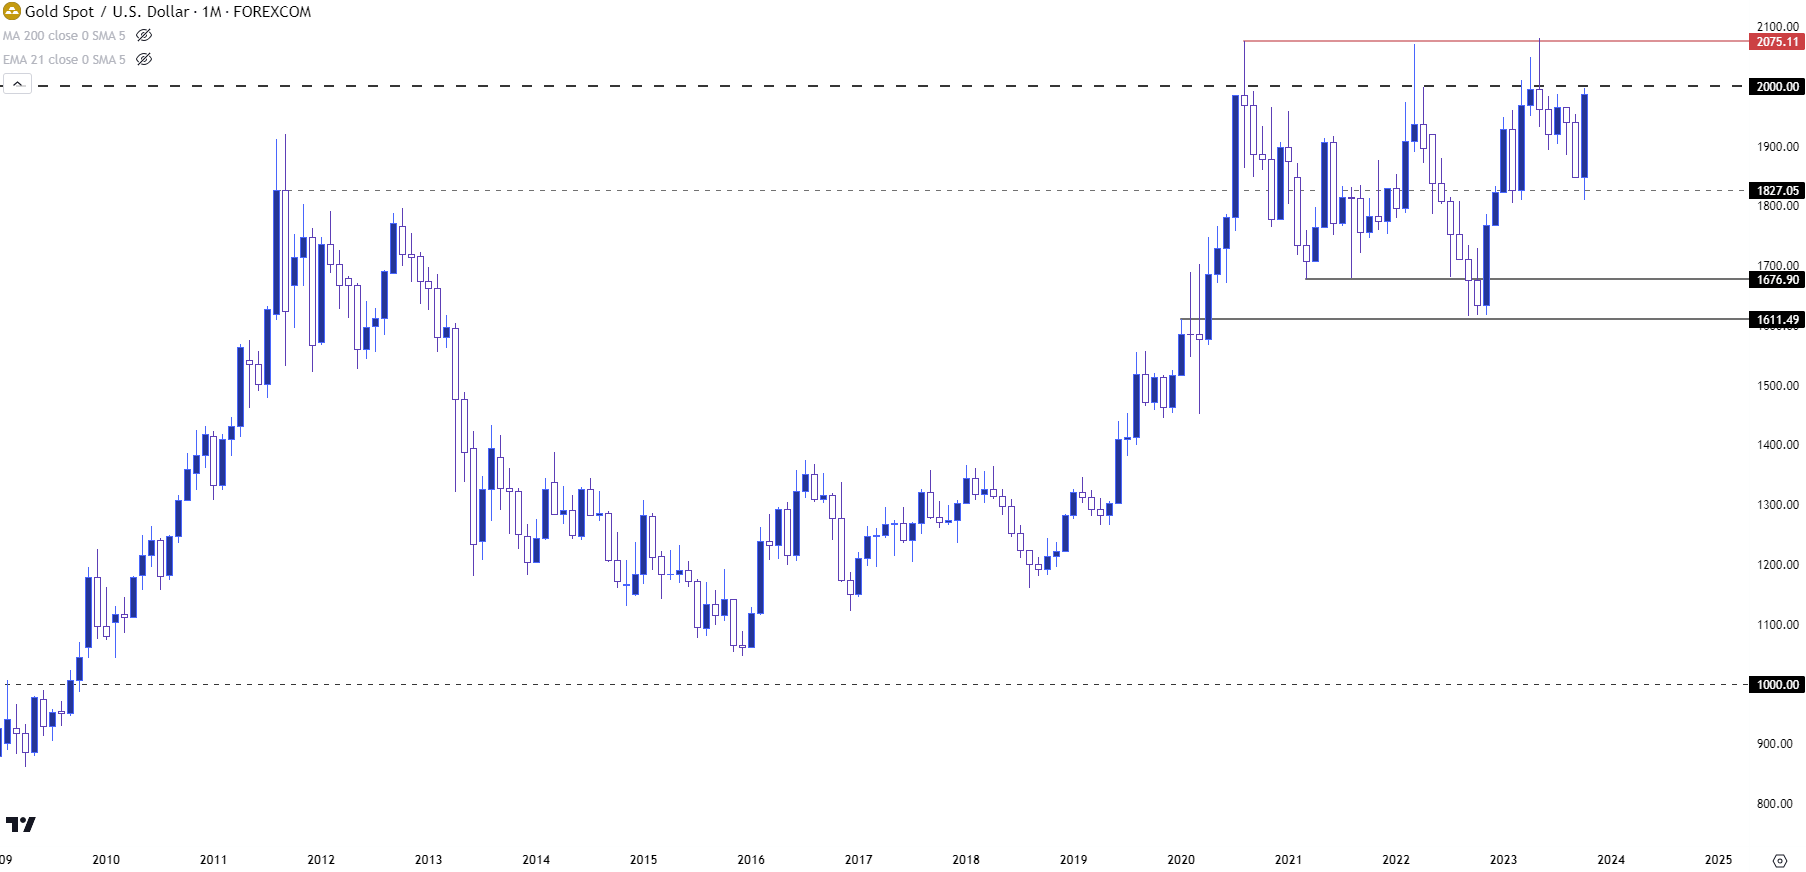 Chart prepared by James Stanley, Gold on Tradingview
Gold Nears Fourth Test at $2k
Gold prices are getting close to their fourth test of the 2k level and of note is how a fourth test would not only indicate an increasing frequency of tests at the big figure. The next test would be a mere six months after the prior test, while the previous $2k test was more than a year after the previous one. And that test in 2022 was a year-and-a-half after the first.
On top that, the test in March-April of this year really lasted for a while as bulls remained fairly persistent. There were even attempts from bulls to hold support at that level, which eventually failed as rates went back on the rise. With a major psychological level of this nature, it can take time for the market to gain acceptance above the new big figure, and that's what this increasing frequency points to, an increasing degree of comfort with gold prices trading above the $2,000 level.
The complication at the moment is that the bullish move has priced in really fast and price has started to show symptoms of stall after an aggressive two week bullish breakout.
Gold Weekly Price Chart
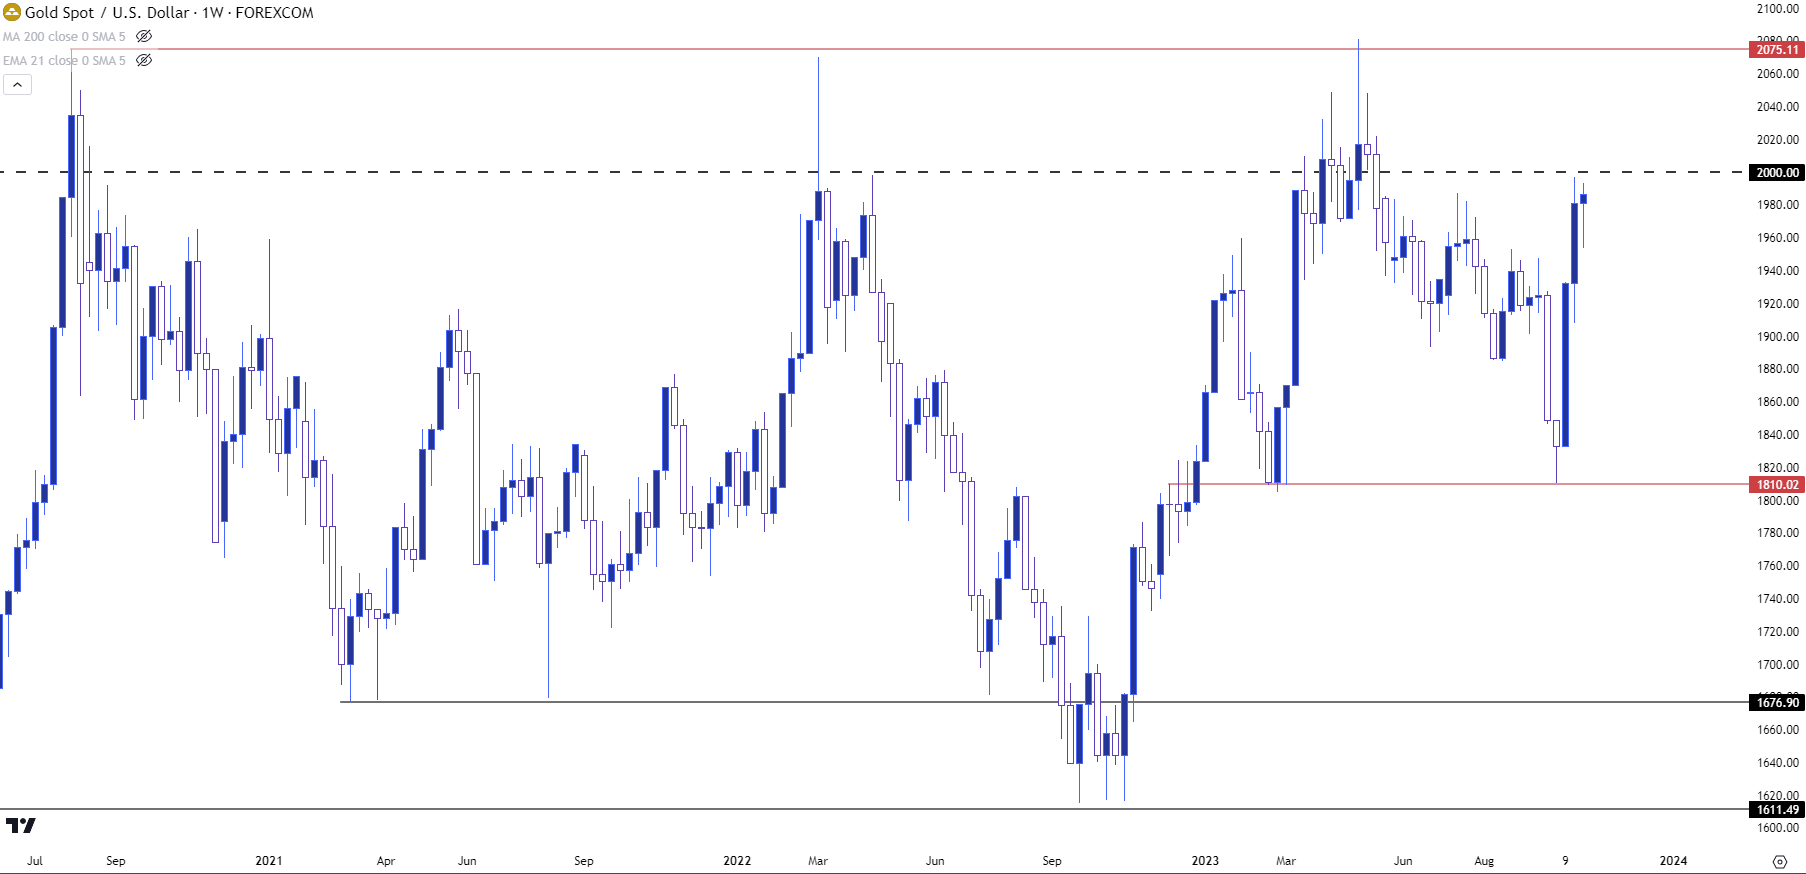
Chart prepared by James Stanley, Gold on Tradingview
From the daily chart we can start to get a better view of the relative move that’s shown so far in October. That pullback from the prior $2k test started in May, and the bearish move worked in an orderly fashion – until the September FOMC rate decision, that is.
It was when the Fed announced that they saw no recession ahead and reduced their expectation for cuts down to two from a prior four that gold prices began to move-lower in an aggressive fashion. The week after FOMC was one of the most bearish outings for spot Gold with the largest weekly sell-off in two years. It didn’t stop there, though, as bears retained control through the October open.
That’s around the time that the sell-off began to stall as shown by spinning tops and dojis printing near the bottom of the move. Something else of interest was happening, as the brute force sell-off happened so quickly that RSI on the daily chart moved into a deep-oversold state, with a daily close below the 20-level.
I wrote an article about gold on the day before the reversal began, and as I highlighted the bearish move had begun to stall with price building a short-term falling wedge formation. That led into a bullish outside day on Friday, October 6th, the same day that NFP was released.
That then led-in to one of the strongest two-week rallies that gold as ever seen; so fast that RSI has already moved into overbought territory with a read above 70.
Now that does not mean that the bullish move cannot continue – in the same way that RSI moving below 30 did not illustrate the end of the sell-off. My interest in RSI is in highlighting the extremes, both the sell-off that created deep-oversold conditions and the corresponding snap back, and the fact that this rally has happened in a very sudden manner.
Gold Daily Price Chart
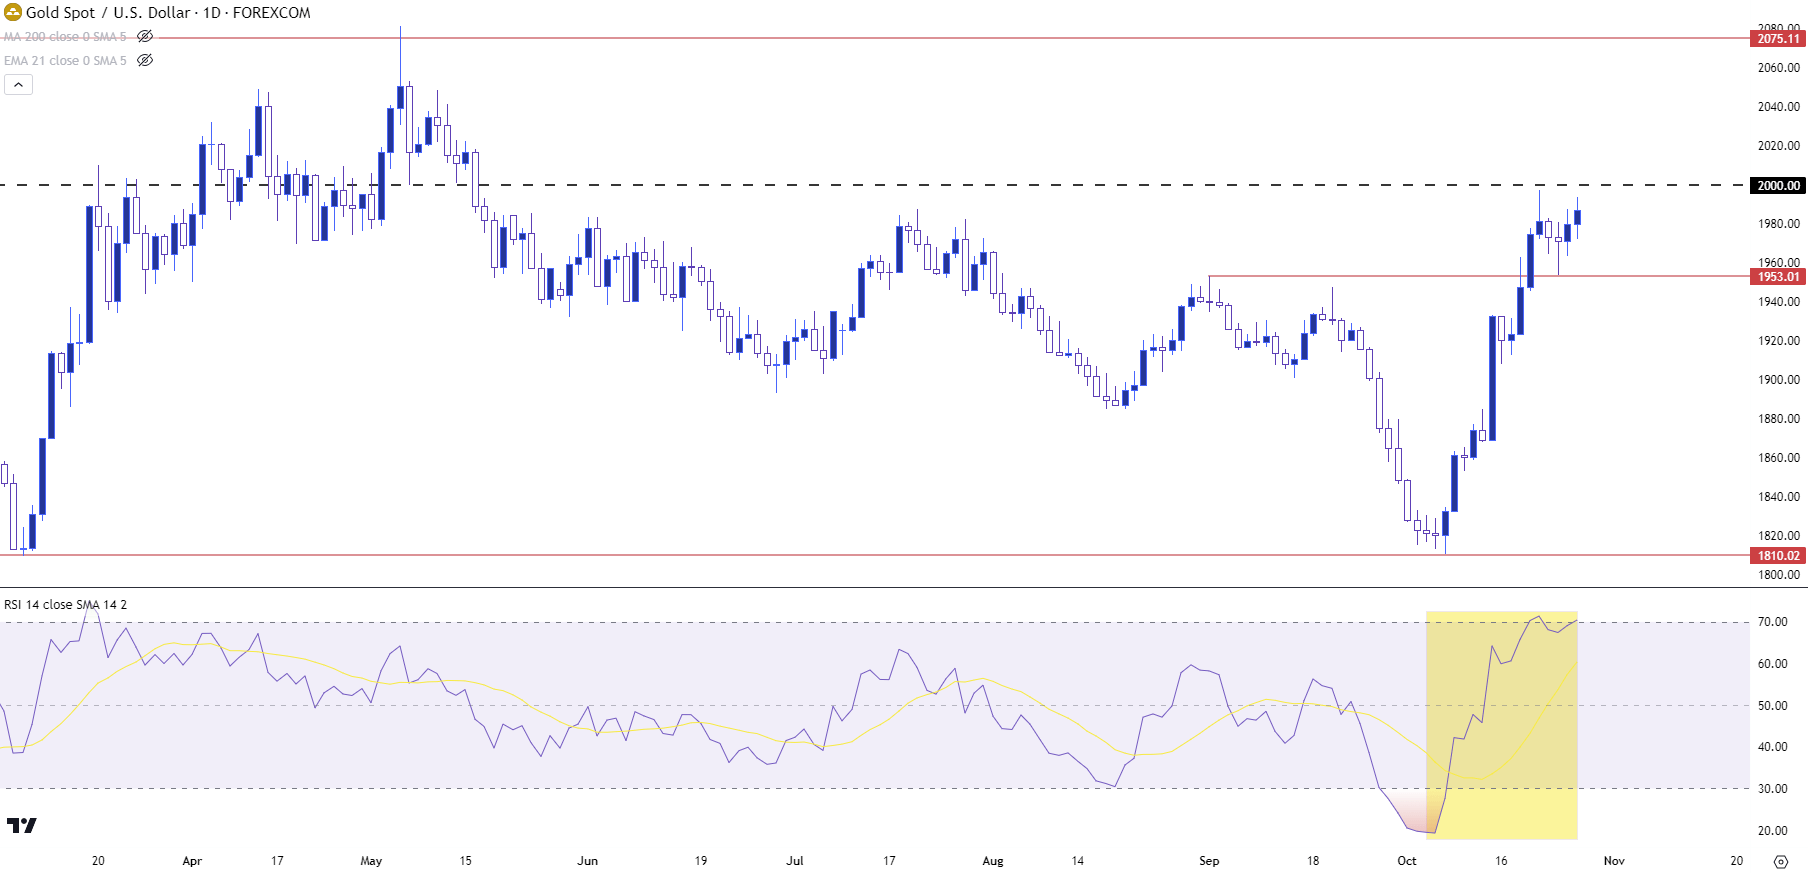 Chart prepared by James Stanley, Gold on Tradingview
Gold Prices: Fourth Time the Charm at $2k?
This is a complex question because we’re looking at a couple of different things. First and foremost, on the bigger picture, addressing the multi-year range in gold, I do believe there’s potential for a sustained break above the $2k handle. For that, I’m largely drawing from what happened at the $1k level back in 2008 and 2009.
In that prior instance it took about 18 months for gold to finally propel above the $1k big figure and after it finally broke-above, it didn’t look back.
The current saga at $2k is now going on three years though, so the timing element isn’t comparable. But what is of interest, in my opinion, is what happened back in 2008 and 2009 that made the sustained break of $1k a reasonable prospect, and that was the Fed coming to markets with accommodation in the form of low rates and QE.
And if we look at the prior $2k instance in March, that seemed to be the forward-drive, as markets began to gear up for possible rate cuts out of the Fed in response to stress in regional banks. The rate cuts haven’t happened, of course, but that hasn’t stopped markets from trying to look around the corner for when they may happen.
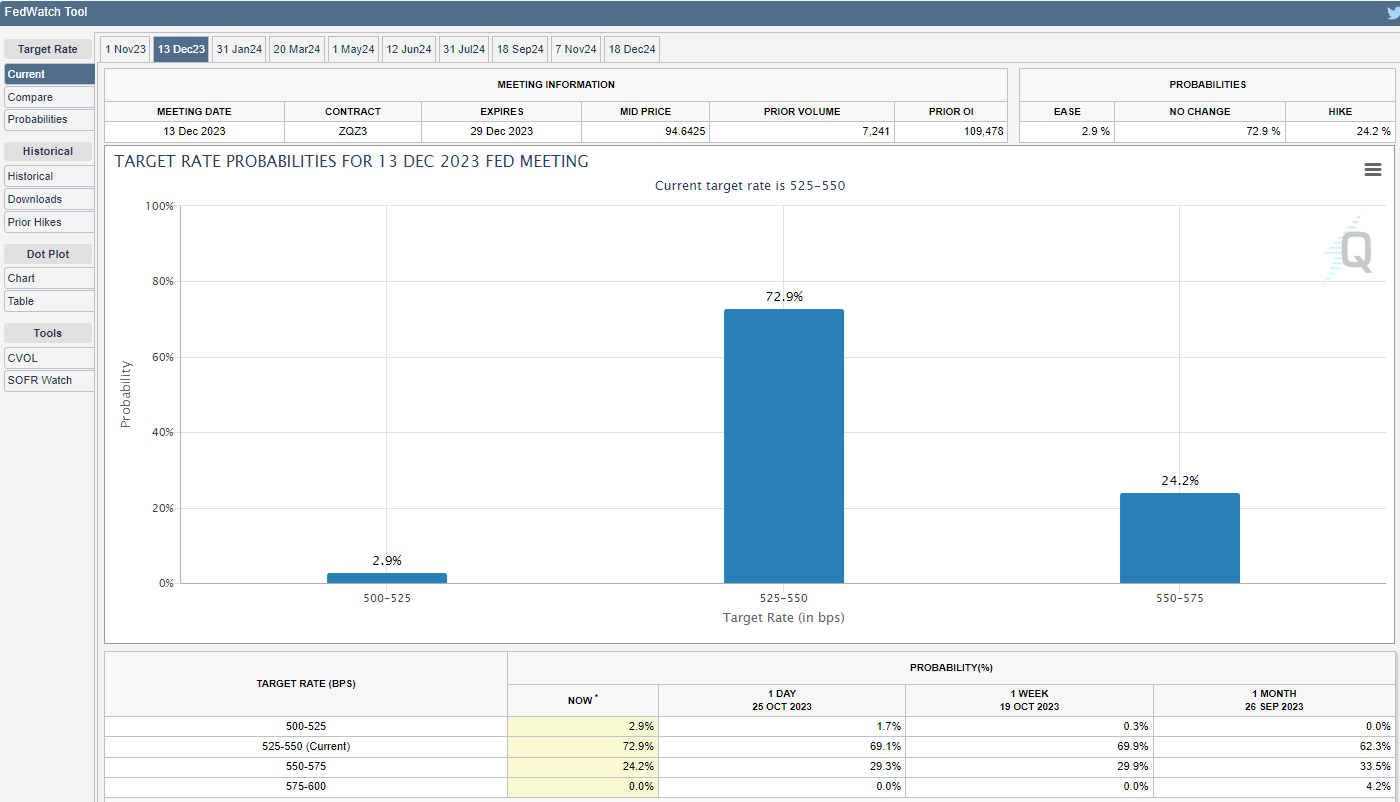
At this point, markets are highly expecting rate cuts from the Fed to begin next year, like what the Fed has shared from their own projections, but there’s also been the pricing-out of another possible hike this year. The probability of one more hike by the end of the year was at 33.5% a month ago, and 29.9% last week and 29.3% yesterday. That has moved down to 24.2% today, and that’s come along with a strong bearish move in equities as bonds have caught a bid.
Rate Hike Probabilities for December 13, 2024 FOMC Rate Decision
 Data from CME Fedwatch
Gold Strategy
At this point the question is whether bulls are in a position to push for that breakout of $2k, and if they are, is this going to be a lasting break?
This is something that will likely be addressed, to some degree, at next week’s FOMC rate decision. That won’t stop market participants from trying to get ahead of the theme, however, and this can keep the door open for bulls to push for that test of $2k. But they may lack the ability to push for a lasting breakout given the already-overbought state of gold, at the moment.
This can keep focus on supports, either now or after a possible $2k test, and price is at a big level currently at 1985. If bulls do force the $2k test and price snaps back, $1985 becomes a massive spot of interest for bullish continuation themes. If buyers can’t hold that, the focus then shifts to 1964 and then 1953-1955.
A failure from bulls to hold that will then put focus back on the longer-term range.
Gold Daily Price Chart
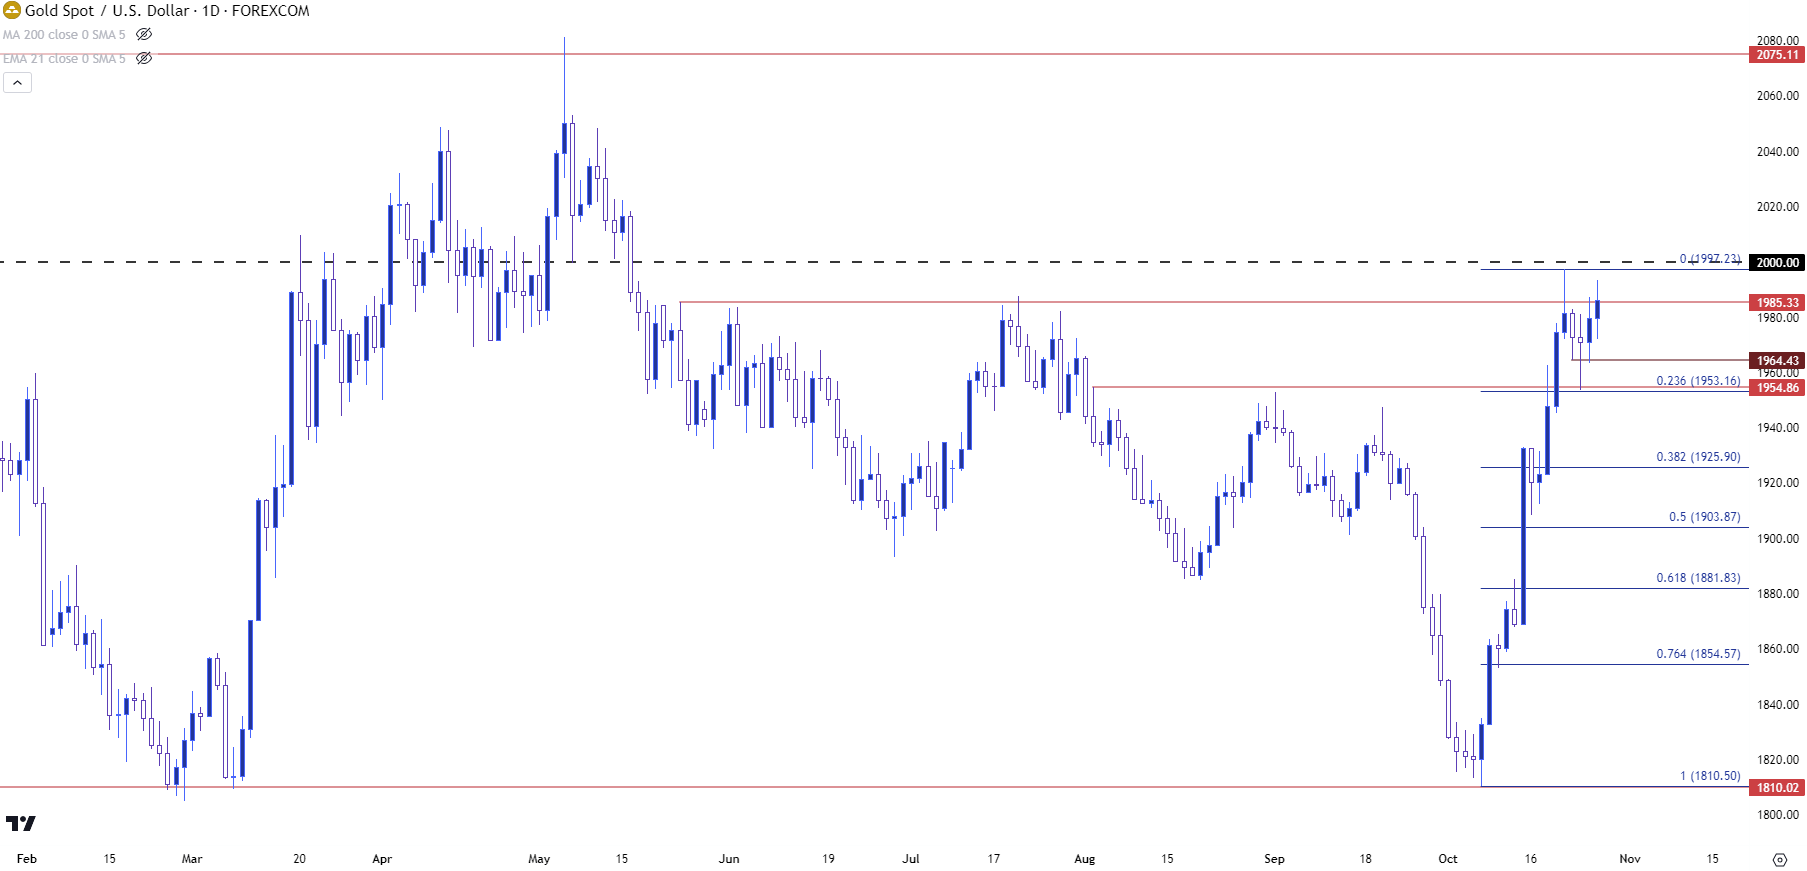 Chart prepared by James Stanley, Gold on Tradingview
--- written by James Stanley, Senior Strategist
