WTI Crude Oil Talking Points:
- WTI is working on its first green weekly bar since mid-May and even that was somewhat brief as it was a mild reprieve in a larger bearish theme that took over after the Q2 open.
- Monday was the big day for bulls and then Tuesday through Thursday saw digestion of the move. A push on Friday off the 38.2 retracement of the recent pullback provides scope for topside continuation into next week, with the 200-day moving average lurking overhead.
- I’ll be discussing these themes in-depth in the weekly webinar. It’s free for all to register: Click here to register.
Trends in WTI crude oil have not favored bulls much so far in Q2, although that may be starting to shift. From December of last year through January of this year, oil prices grasped for support at the 70-handle. That began to shift in late-January and early-February as volatility woke up and price put in a grinding move above the 200-dma, eventually setting a fresh six-month high in the first two weeks of Q2 trade.
But that’s when the proverbial music stopped as prices began to snap back and there were a couple of aggressive phases in that sell-off as bears continued to push. That lasted all the way into early-June trade, with bulls re-appearing on Tuesday the 4th and continuing to push through much of the past week.
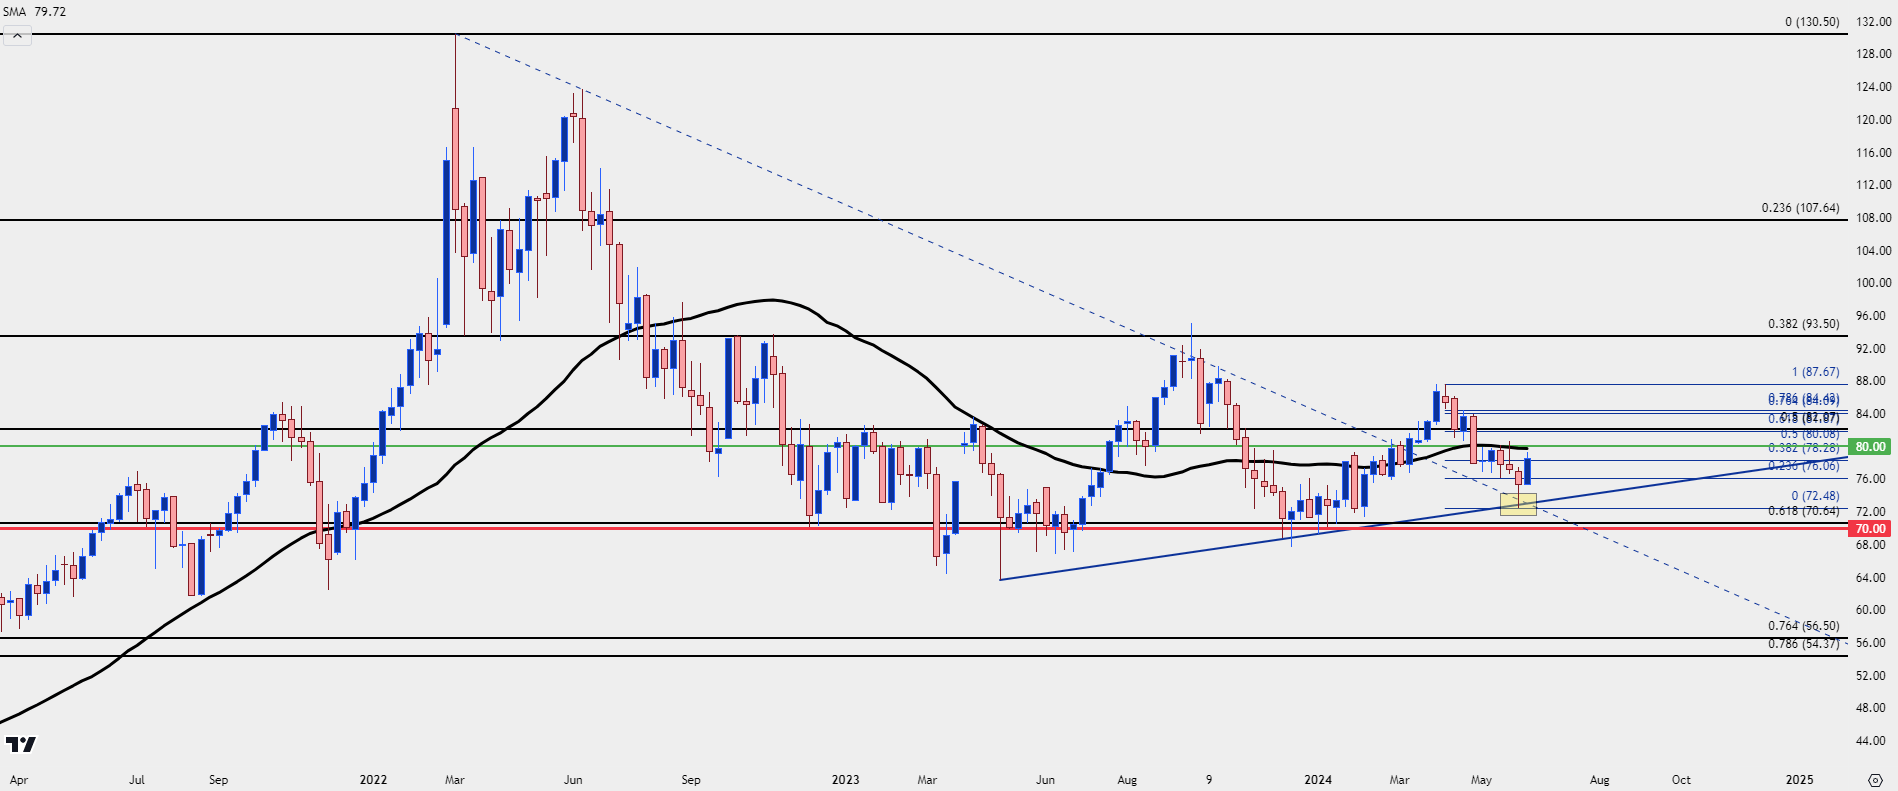
On the below weekly chart, there’s a clear obstacle sitting overhead at the 200-day moving average, currently confluent with both the 80-handle and the 50% retracement of the Q2 sell-off.
WTI Crude Oil – Weekly Chart
 Chart prepared by James Stanley; data derived from Tradingview
WTI Shorter-Term
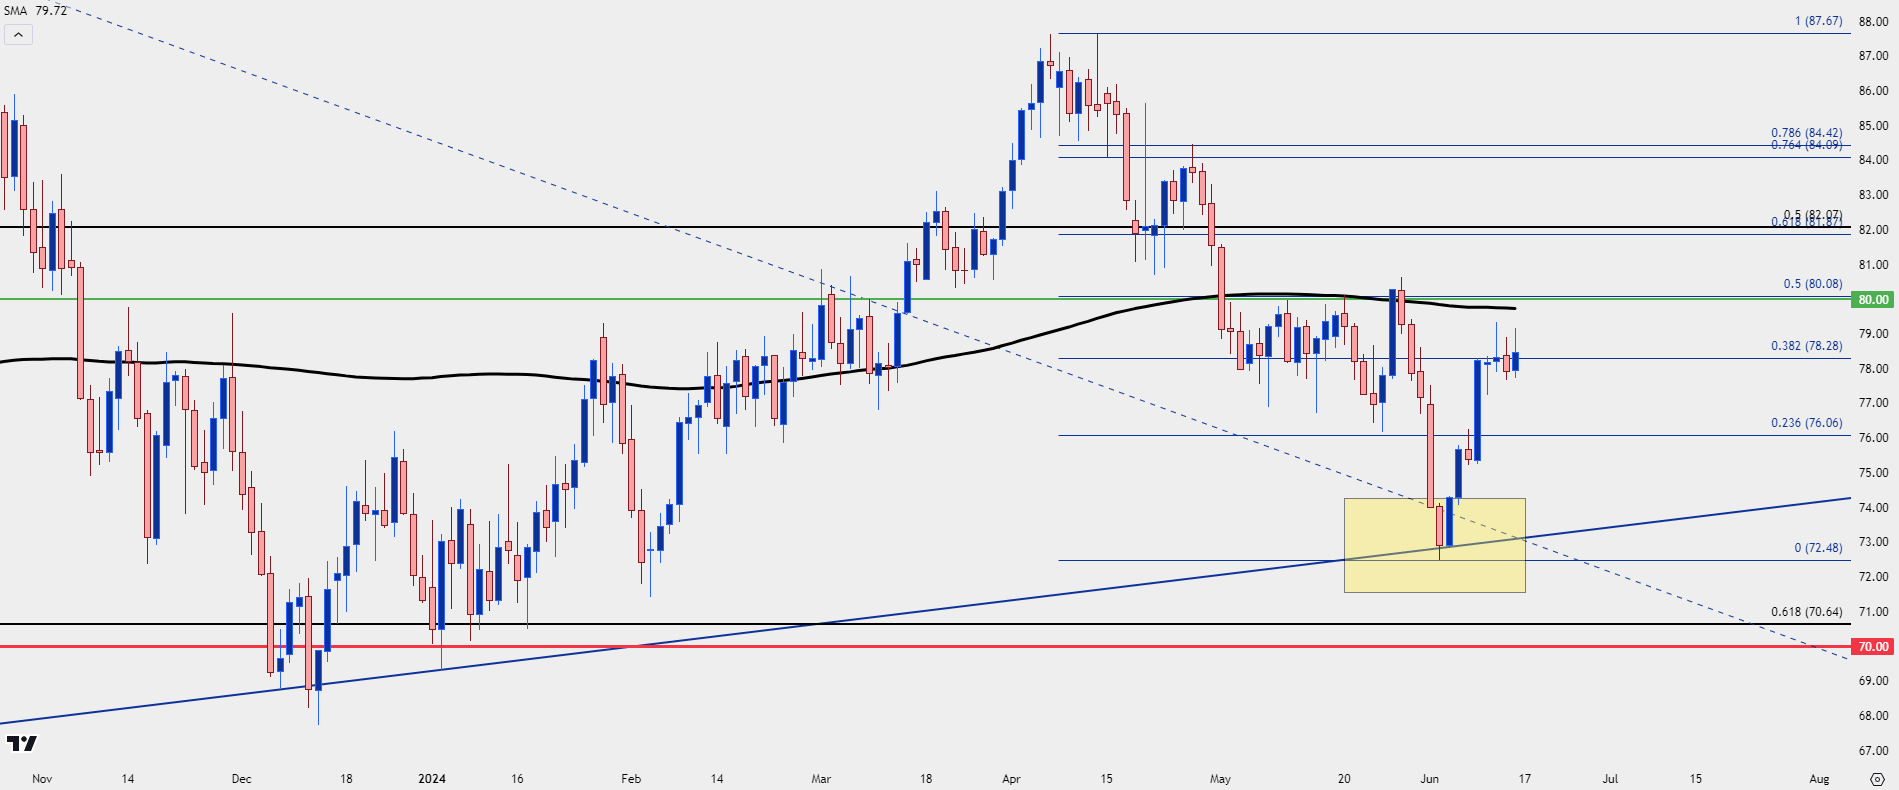
From the daily chart, much of the past week’s strength was concentrated to Monday and at that point, it was a possible pullback in a broader bearish move. But Tuesday through Thursday were somewhat constructive as price held fairly well and then on Friday, bulls made another push to get back-above the 38.2% retracement of the Q2 sell-off.
The larger obstacle is overhead, however, as there’s quite a bit lining up at the 80-handle. That’s very close to both the 50% retracement of the same move, and the 200-day moving average. There was a steady build of resistance in that region in May, and after bulls failed to hold a breakout at the end of the month, sellers swarmed to push to a fresh three-month-low.
But, bulls quickly returned to claw back a portion of that move and given the pace of the trend from the past week, it appears that they have an open door to push for a re-test of the psychological level at $80/brl.
WTI Crude Oil Daily Chart
 Chart prepared by James Stanley; data derived from Tradingview
WTI Even Shorter-Term: Levels, Risks
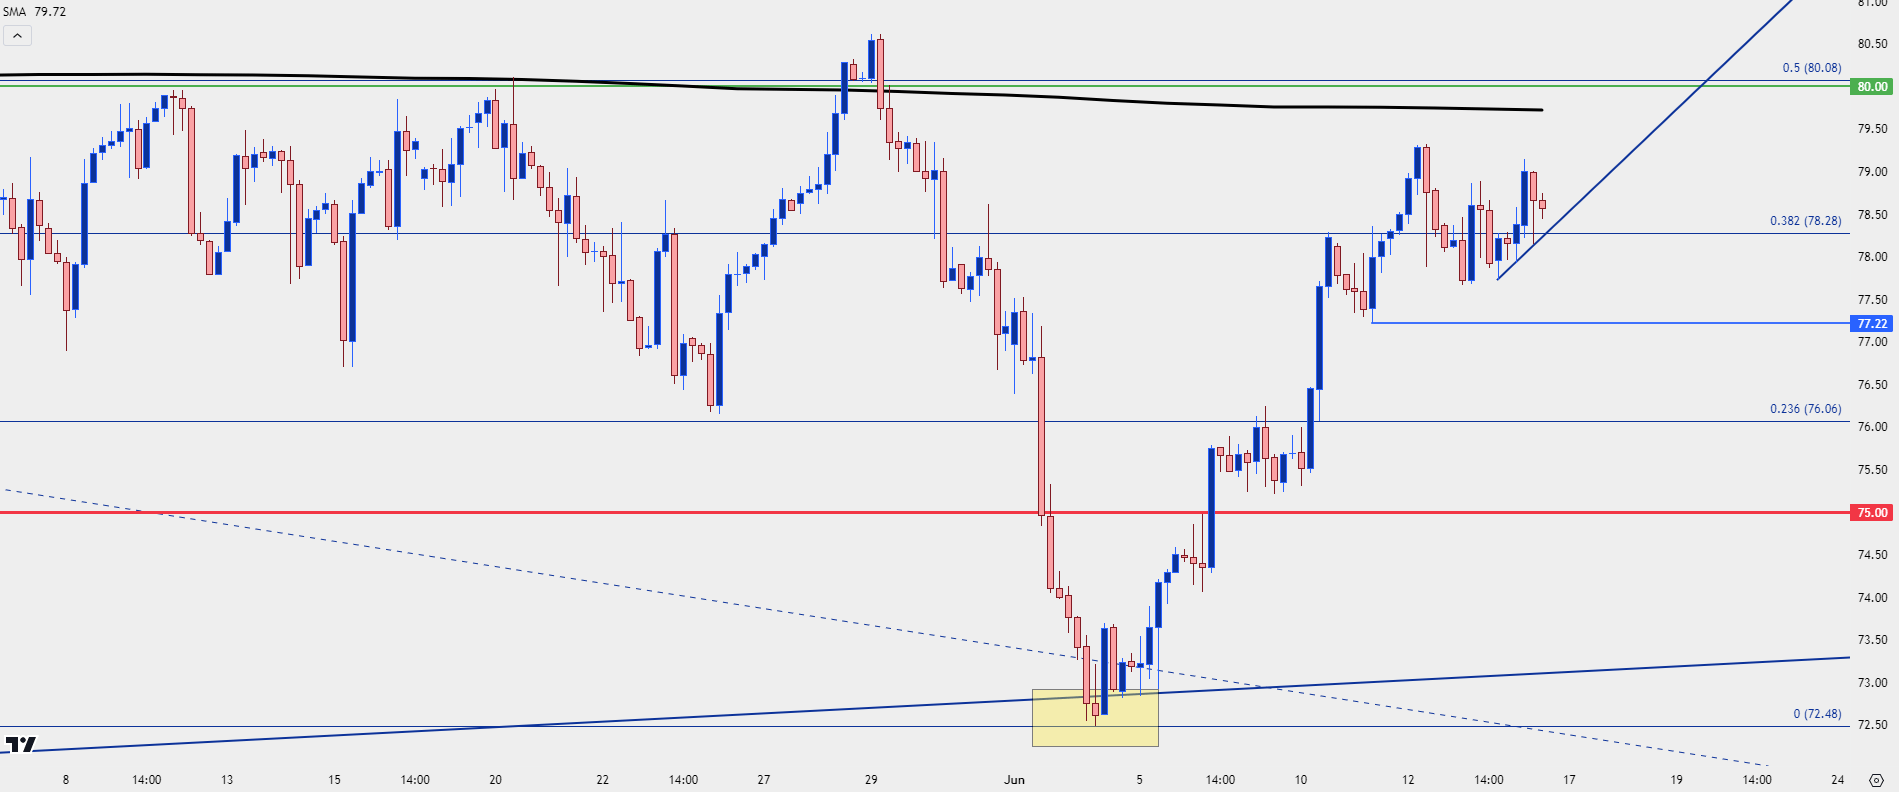
From the four-hour chart we can see a series of higher-lows posting after resistance had set-in. With a diminishing marginal impact of resistance, leading into those higher-lows, the door remains open for bulls to press into bigger picture resistance.
But should they fail to do so, there’s another couple of levels below current price that can remain of interest for support potential. The higher-low on Tuesday of this week plots at 77.22 and ideally, that would remain defended to keep the bullish trend in order. But, given the pace of the rally, there’s also potential for support to play-in off the 23.6% Fibonacci retracement that helped to hold the highs the previous week, and that plots at 76.06.
The 75 level seems to be somewhat of a red line in the sand, at this point. It was broken through and bulls did not allow for a re-test of support at prior resistance. If buyers fail to hold above that level, there will be question around topside potential and that may even lead into another bearish theme as the two-week pullback in the Q2 sell-off would appear to be a failure.
But, until then, bulls have control along with an open door to re-test confluent resistance at the 80 psychological level, and if they can break through that the door would open to broad-based bullish continuation scenarios.
WTI Crude Oil Four-Hour Price Chart
 Chart prepared by James Stanley; data derived from Tradingview
--- written by James Stanley, Senior Strategist


