Stocks markets have seen a great deal of volatility over that two days. Stocks are down roughly 90 to 100 handles and the VIX is up about 5.00. DXY has been getting crushed as well, down about 40 pips over the 2-day period. These moves have been blamed on the poor ISM Manufacturing data yesterday and the downward revision to the ADP data out this morning (which in turn, is forecasting a worse than expected Nonfarm Payroll number of Friday).
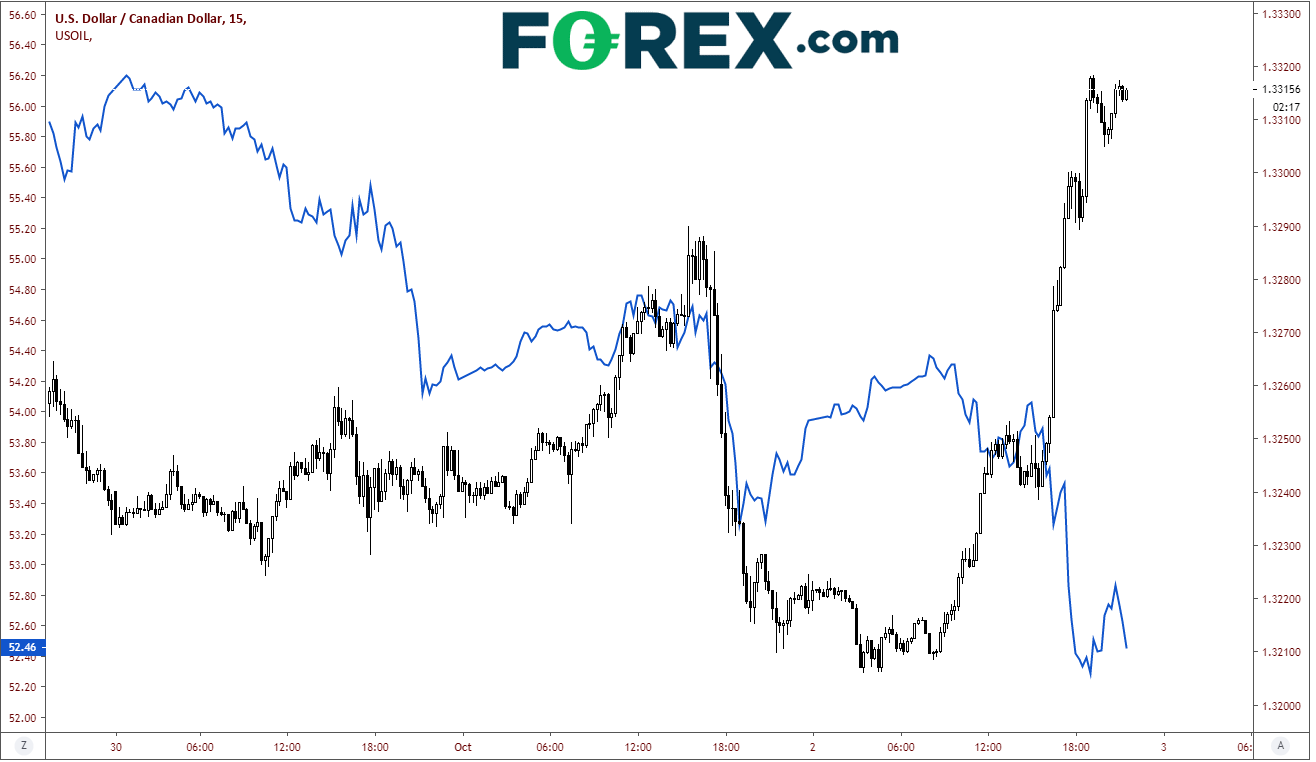
If the US Dollar has been hit so hard over the last few days, then why is USD/CAD so bid over the last 2-days? OIL! The Canadian Dollar and the price of oil move together, that is, USD/CAD and WTI are inversely related. Moving lower along with stocks and the US Dollar has been the price of West Texas Oil (blue line), which is down about 3% over the past couple of days. Therefore, the price of USD/CAD has been moving higher.

Source: Tradingview, FOREX.com
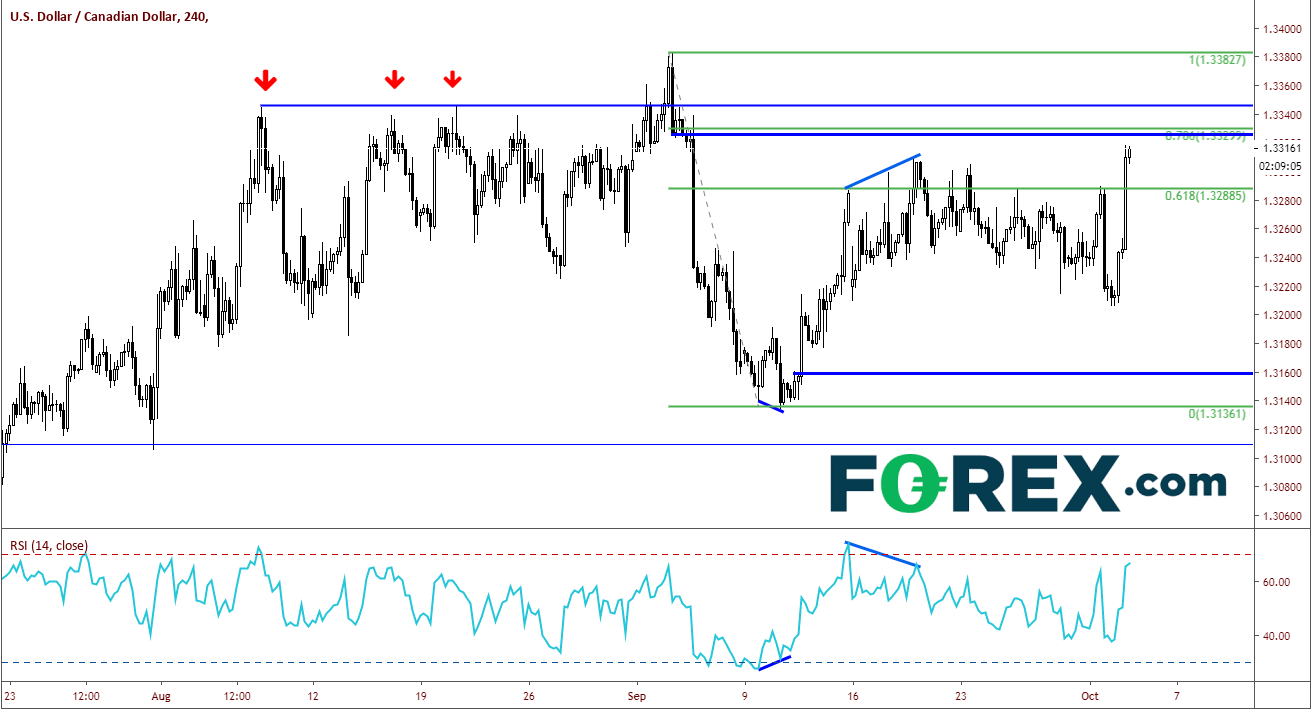
USD/CAD took off today, up almost 100 pips, just ahead of strong horizontal resistance at 1.3320 and the 78.6% retracement level from the highs on September 4th to the lows on September 10th at 1.3230. First support comes in at 1.3288. Below that are the previously mentioned lows from September 10th.

Source: Tradingview, FOREX.com
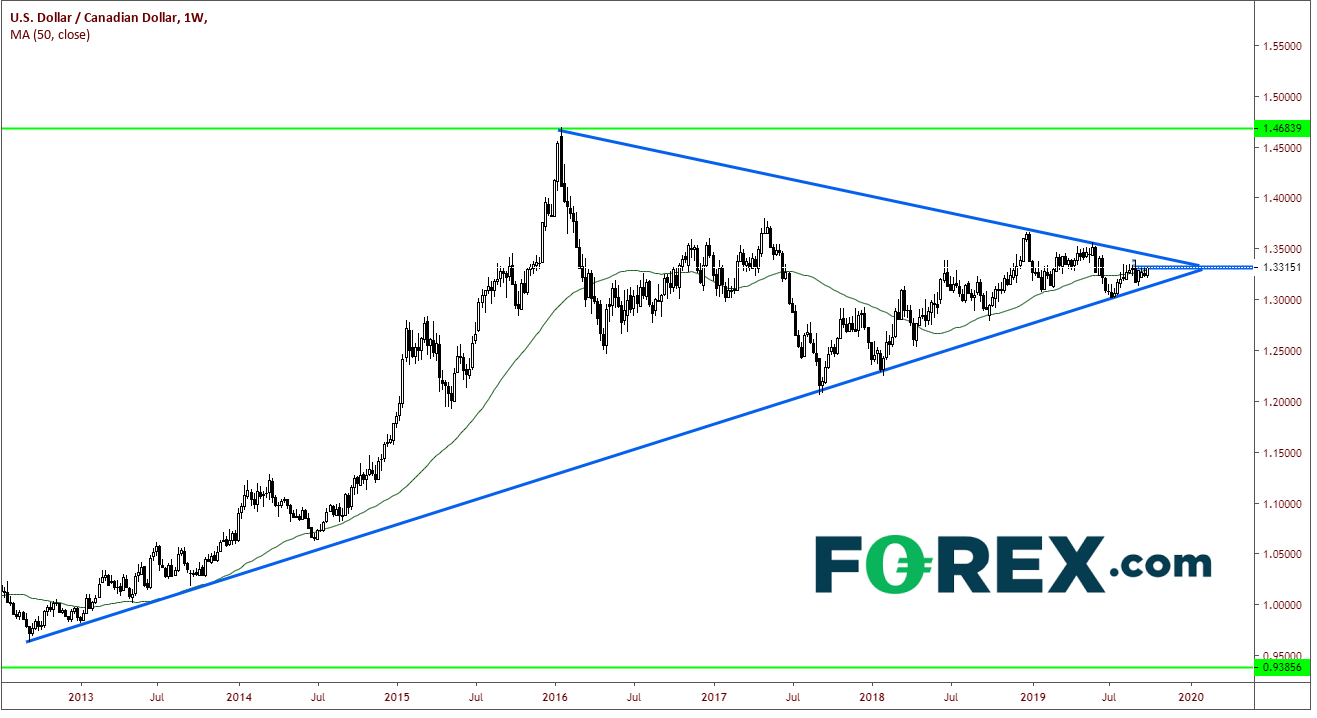
However, PAY ATTENTION TO THE WEEKLY CHART! USD/CAD IS wound up tightly inside this symmetric triangle on the weekly chart. The downward sloping trendline comes in at roughly 1.3435. The upward sloping trendline comes in at roughly 1.3135. THE BREAK OF EITHER OF THESE TRENDLINES MAY DETERMINE THE NEXT LONGTERM DIRECTION OF USD/CAD.

Source: Tradingview, FOREX.com


