After pausing briefly on this morning’s slightly softer-than-anticipated inflation data (see my colleague Fawad Razaqzada’s post, “Dollar extends but CPI miss not a game changer” for more), US stocks have resumed yesterday’s selling rout. As of writing, the Dow Jones Industrial Average is trading off by another 500+ points, with the S&P 500 falling by more than 2% as well.
Interestingly, the tech-heavy Nasdaq index (-1.2% as we go to press) is outperforming the more traditional large-cap indices after seeing the worst performance yesterday, but when it comes to US stocks, there’s nowhere to hide. All 11 sector SPDR ETFs are falling on the day, with Energy leading the way lower at -3% as WTI sheds 3.5% on the day.
That said, we are seeing some differentiated performance among other asset classes, unlike yesterday. High-quality bonds are on the rise, with yields on the benchmark 10-year Treasury falling 4bps to 3.13%. Perhaps most impressively, the long-maligned “useless yellow rock” has quietly broken out of its two-month range to trade up near $1225, its highest level since late July.
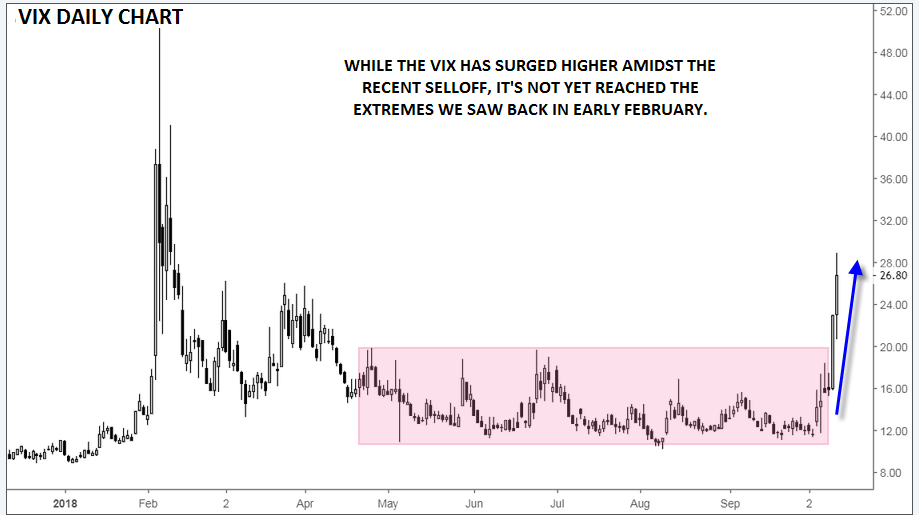
Not surprisingly, this week’s market disruption has led to a big surge in the CBOE’s Volatility Index, Wall Street’s so-called “fear index.” The VIX measures the market’s expectation for volatility over the next 30 days, using the implied volatility of the front two months’ put and call options on the S&P 500.
While the calculation itself would put most readers to sleep, the current VIX chart is worth watching. After hitting historic lows under 9 through last year’s consistent rally, the VIX exploded to a peak above 50 amidst the last major interest-rate-driven market disruption in early February. After settling back down into the low teens throughout Q2 and Q3, the index has surged to peak near 29 so far today.
What does that tell us? For one, traders are not (yet) pricing as much volatility as they were in early February; colloquially, you could say that traders are not as “scared” as they were back in February. It would likely take another day or two of strong selling pressure to reach a peak in the 48+ range that has marked significant bottoms on four occasions (May 2010, August/September 2011, August 2015, and February of this year). That said, we’ve seen plenty of near-term market lows form with VIX readings in the 25-30 range, so we may well see a bottom form in the coming days.
While its notoriously difficult to trade, the VIX can provide a real-time gauge of the amount of panic in the US stock market; based on the current reading, traders are clearly wary, but fear has not yet reached the post-GFC peaks that marked major longer-term bottoms.

Source: TradingView, FOREX.com


