USD/JPY Talking Points:
- The US Dollar pushed into oversold territory on the weekly chart and we’re seeing some pullback today, with notable moves in both EUR/USD and USD/JPY.
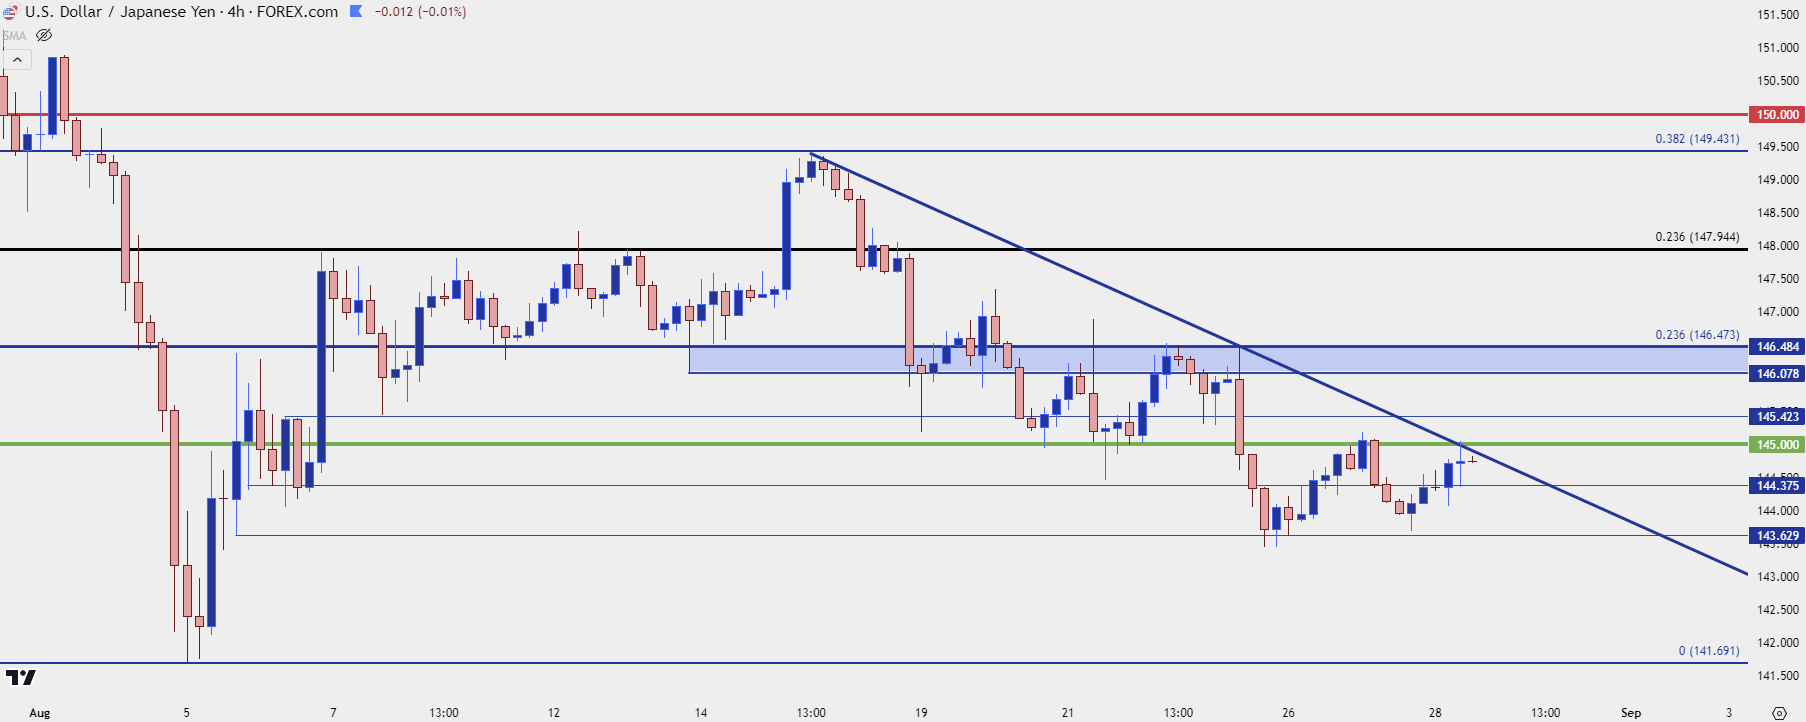
- In USD/JPY, I believe that carry unwind themes remain important. But this doesn’t mean that moves will show in a linear manner and the sell-off from confluent resistance that came into play two weeks ago spanned almost 600 pips. The 145.00 level that I looked at last week is now showing as resistance but the prior reaction there led to a higher-low. Below I look at strategy around that.
Trends often don’t move in straight lines. Of course, if looking at the USD/JPY deluge in July it might be enticing to think otherwise, but even that had some two-sided action such as the inflection we saw at 151.95 (which remains a level of importance).
Last week, as USD/JPY was posing the re-break below 145.00, I cautioned against chasing the move. And, instead, I cast the gaze for lower-high resistance at a key zone that spans from 146.08 to the Fibonacci level at 146.48. The breakdown move ended up snapping back, and ahead of Jerome Powell’s speech at Jackson Hole there were two resistance tests at the latter level, with sellers ultimately prevailing and prodding that next break below 145.00 in a trend that continued through this week’s open.
That price then became resistance, and it held the highs yesterday morning, which kept open the door for continued bearish structure: but the reaction there held a higher-low and we’re already seeing the 145.00 level back in-play as resistance; and this starts to take on the tone of a possible bear trap.
USD/JPY Four-Hour Price Chart
 Chart prepared by James Stanley, USD/JPY on Tradingview
USD/JPY Fundamentals
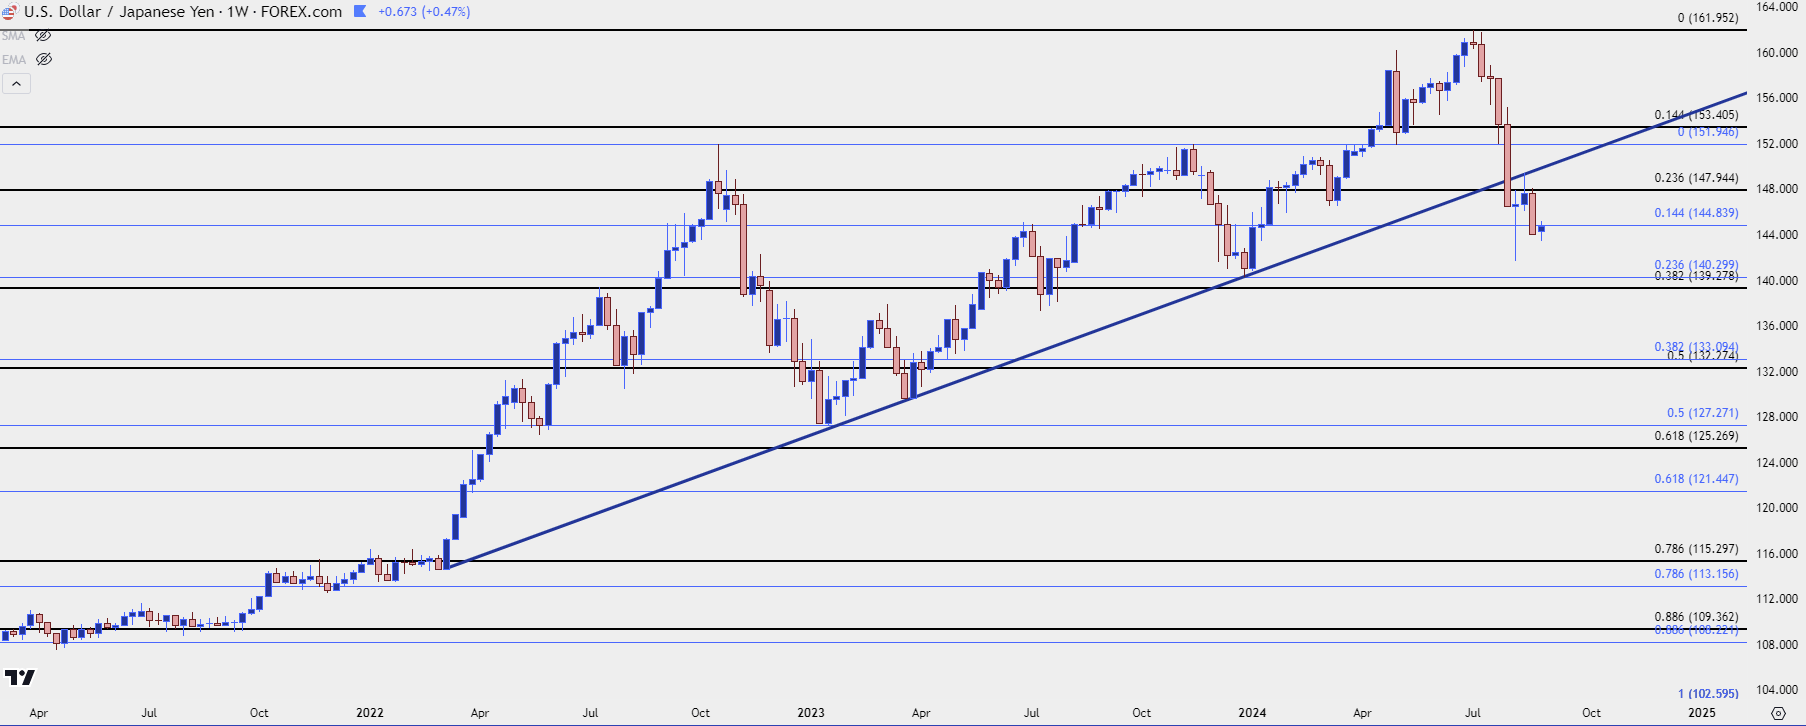
With the US expected to begin cutting rates next month with expectations for even more cuts after, the case on the long side of the carry gets less and less attractive. As a matter of fact the statement can be made that the carry trade in USD/JPY hasn’t been this unattractive since before the Fed started hiking rates back in March of 2022. At the time USD/JPY was trading all the way down around 115.00.
With bad or negative US data, the expectation grows for even more rate cuts from the Fed, and that can further diminish the bullish case for the long side of the carry trade in USD/JPY.
To be sure, this isn’t the first episode of carry unwind in the pair since that theme had started in 2021. There were two pullback scenarios, in November of each of the past two years, in which carry traders quickly bailed out of the trade for fear of reversion. In both of those instances it was the 151.95 level that held the highs and that price was back in-play as support in May, after the BoJ’s intervention at the 160.00 level.
At this stage you’ll notice that there’s a lot of that bullish trend still showing in USD/JPY; and it was the 23.6% retracement of that move that helped to hold resistance for each of the past three weeks.
But what differs from this scenario and the prior two instances of pullback in the pair in 2022 and 2023 is the fact that, this time, the Fed is ready to cut. And the only question seems to be how much and how quickly they can go.
USD/JPY Weekly Price Chart
 Chart prepared by James Stanley, USD/JPY on Tradingview
Timing Trends and Running with Retracements
I’m of the belief that no analysis is perfectly predictive. Fundamental analysis can be helpful for describing why a trend has happened and how much continuation potential may be present. Technical analysis helps with levels, risk management and strategy.
In a case such as we have in USD/JPY, where I consider the fundamental backdrop to be bearish with the possibility of more, the quandary then becomes timing; and for that I think technical analysis can be quite helpful.
The fact that we’ve seen a bit of stall over the past couple of days along with the recent higher-low says to me that we may be seeing a larger retracement. This doesn’t necessarily have to come from fresh longs triggering, hoping that the carry trade continues: It can come from shorts closing positions, as well. And as we push up to fresh highs then longer-term bulls still holding on to carry trades have the option to wiggle out of the move in effort of taking advantage of the bounce.
This is what I was referring to earlier in August, cautioning against chasing an oversold market even with the fundamental backdrop growing more bearish. And like I said then, it’s major big figures that could be appealing for longer-term bulls to take note while exiting positions.
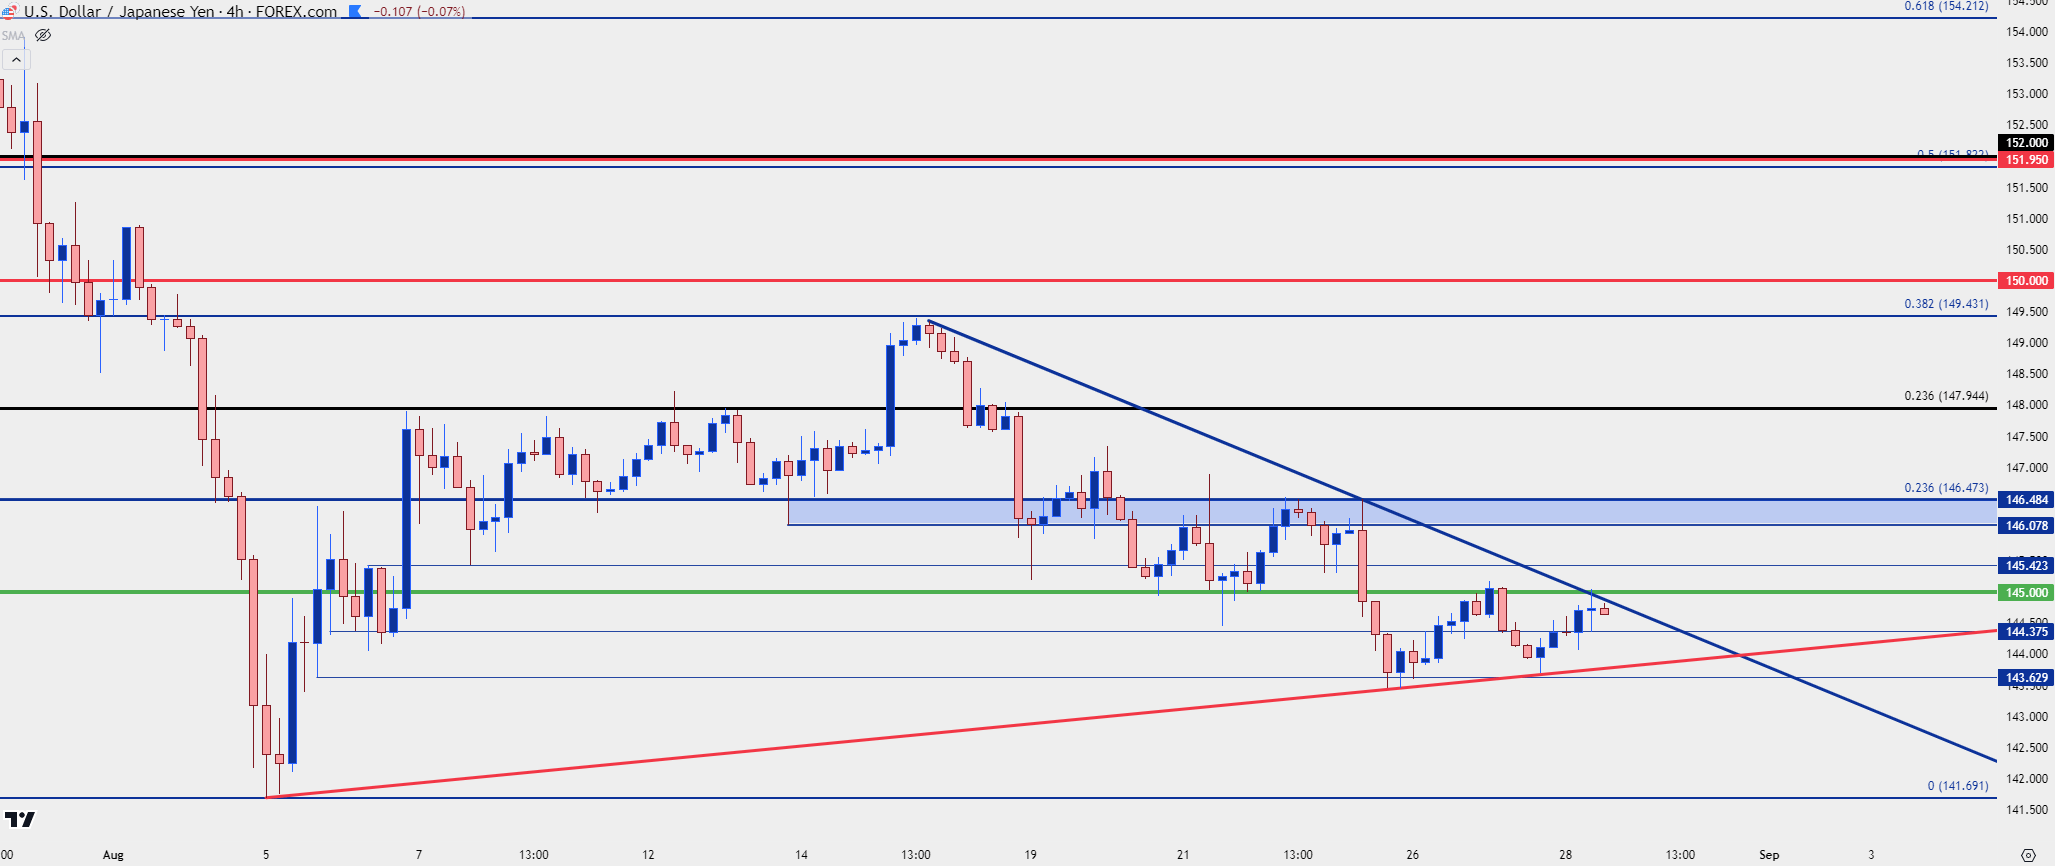
That’s what happened at the 38.2% retracement of the sell-off which then led to a near-600 pip reaction. But that, so far, has held a higher-low. And then the 145 reaction has since held another higher-low as you can see on the red trendline on the below chart.
This can be growing scope for a deeper retracement in the broader bearish trend, and this is why I suggest that we may be seeing a bear trap at 145.00. The bigger question is how aggressive bears remain to be and, like last week, I’m casting that gaze for resistance a bit higher to the 146.08-146.48 zone. If sellers can hold the former level, that would constitute a lower-high. If they can’t, the look then goes to 148.50, 150 and then the familiar 151.95 level, which is confluent with the 50% mark of the sell-off.
If you see the pair push back above the 150 price, don’t be surprised to see headlines proclaiming that the carry trade is back. But given the fundamental backdrop and the Fed’s proximity to a rate cut cycle, that argument wouldn’t appear to hold much water.
USD/JPY Four-Hour Price Chart
 Chart prepared by James Stanley, USD/JPY on Tradingview
--- written by James Stanley, Senior Strategist


