
USD/JPY, U.S. Rates Summary
Long-term borrowing rates in the U.S. saw massive change last year. The benchmark 10-year note saw yields fall in Q1 as worries of regional banking stress took over, eventually hitting a low at 3.25% in April. But inflation remained and the Fed had to entertain the prospect of further rate increases which helped the 10-year to push all the way up to 5% in early-October. At that point the Treasury department shifted their plans for 2024, preferring to offer more short-term debt and this helped longer-term yields to soften into the end of the year, with the 10-year yield falling to a low of 3.78%. This week sees both monetary and fiscal policy on display on Wednesday as the Treasury will issue their Quarterly Refunding Announcement (QRA) that will be of interest for longer-term rates. And then Jerome Powell will speak to the prospect of rate cuts in 2024 later that day. And then on Friday we get updated employment statistics with the release of Non-farm Payrolls (NFP).
A big week for global markets is ahead but perhaps the most notable event for this week is also one of the least followed, at least traditionally speaking. The U.S. Treasury department’s Quarterly Refunding Announcement is not an event known for its fanfare. As a matter of fact, if reading about this last year you’ll probably notice how several analysts noted that they’d never cared about it or perhaps even known of this before. But it’s also been some time since we’ve seen such volatility in Treasury markets and given the Fed’s stance where a cutting cycle may soon by on the way, it makes sense as to why there’s been so much activity in one of the most important markets in the world.
The U.S. government operates on debt and with debt-to-GDP at 120 the constant issuance of debt is a necessity. For this year there’s a lot of long-term debt coming due, and you’ve probably noticed throughout last year that long-term rates are elevated, making for an ill-opportune time to re-fund that debt as it comes due. And with a large amount of potential supply coming online, market participants won’t usually wait around as they’ll start to price in the anticipation of that supply before it ever comes online.
As inflation retained strength in late-Summer of last year, this was one of the forces behind the move in both US Treasury yields and the U.S. Dollar. DXY put in an 11-week consecutive streak of gains, which is rare, from the lows in July into early-October. Along the way the yield in 10-year Treasuries jumped to a fresh 16-year high, testing levels that hadn’t been seen since before the financial collapse.
U.S. Treasury 10-Year Yields
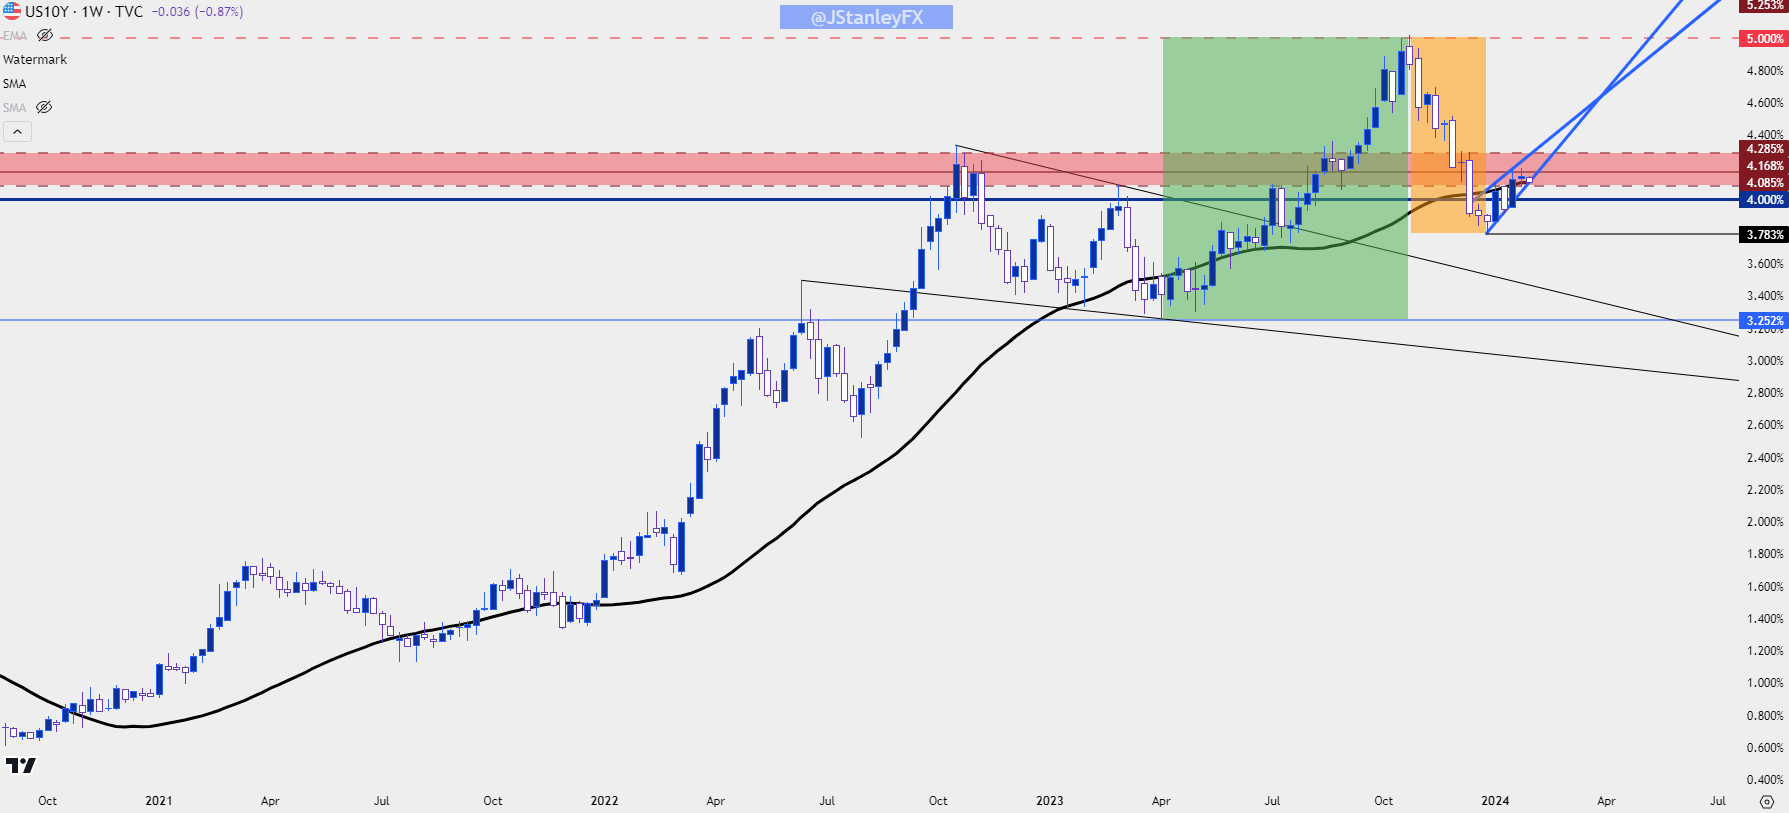 Chart prepared by James Stanley; data derived from Tradingview
Along the way several other market items appeared, like stocks selling off, or major currencies like the Euro testing the vaulted 1.0500 level against the U.S. Dollar. There was quite a bit of fear in the month of October but this began to dissipate with a strong relief rally taking over on November 1st at the conclusion of the FOMC rate decision that day.
But there was another event that happened at the end of October that didn’t get as much fanfare, and that was the maneuvering of the U.S. Treasury department. As fears of greater supply of long-term debt began to dissipate, a rally started to show in Treasuries as the yield that had been priced-in a few months earlier was clawed back. And then on November 14th, an encouraging CPI report gave markets the next clue that the Fed may actually be done with hikes, and that helped to sink the U.S. Dollar while further feeding into the idea that rates had topped.
That risk-on theme drove with aggression into the end of the year, and there were a number of related themes: Falling long-term U.S. yields, stocks rallying like it was the summer of 2020, U.S. Dollar weakness which helped to boost the Euro, Pound and Japanese Yen.
It got to the point where rates markets were pricing in a full six 25 bp rate cuts from the Fed this year, in a backdrop where stocks were pushing fresh all-time-highs and the unemployment rate remained pegged near multi-decade lows; and that’s largely still where we are today. This week will be the next installment on this theme as we’ll first hear from the Treasury department on Wednesday morning regarding their plans for debt issuance this year. There’s a web cast scheduled at 11 AM ET, and this is followed by the 2 PM announcement from the Federal Reserve.
There’s no moves expected there and this is not a quarterly meeting so that means that we’ll need to wait until March for updated projections. But, that also means that the large item here is probably the press conference with Jerome Powell following the announcement. He was noticeably dovish in November and even moreso in December, which helped to assist with those cross-market shifts mentioned earlier.
And then on Friday we get the next look at the labor market with the release of Non-farm Payrolls. Oh, and along the way we’re going to hear from numerous mega caps with their quarterly earnings reports so it’s going to be a very busy week across markets.
In the USD, the big question is whether Dollar bulls can drive a fresh trend or whether Powell’s appearance on Wednesday will repel them such as we saw in November and December. The November 1st FOMC meeting marks a recent high for the currency as that kick-started the sell-off that drove into the end of the year. And then the December 13th FOMC rate decision was another major push point that led to a downside break of the 200-day moving average.
The 200-DMA has been back in the picture for the past two weeks but this time as resistance. It has so far capped the rally from the December lows and the big question for this week is whether bulls can break on through to the other side.
U.S. Dollar Daily Price Chart (indicative)
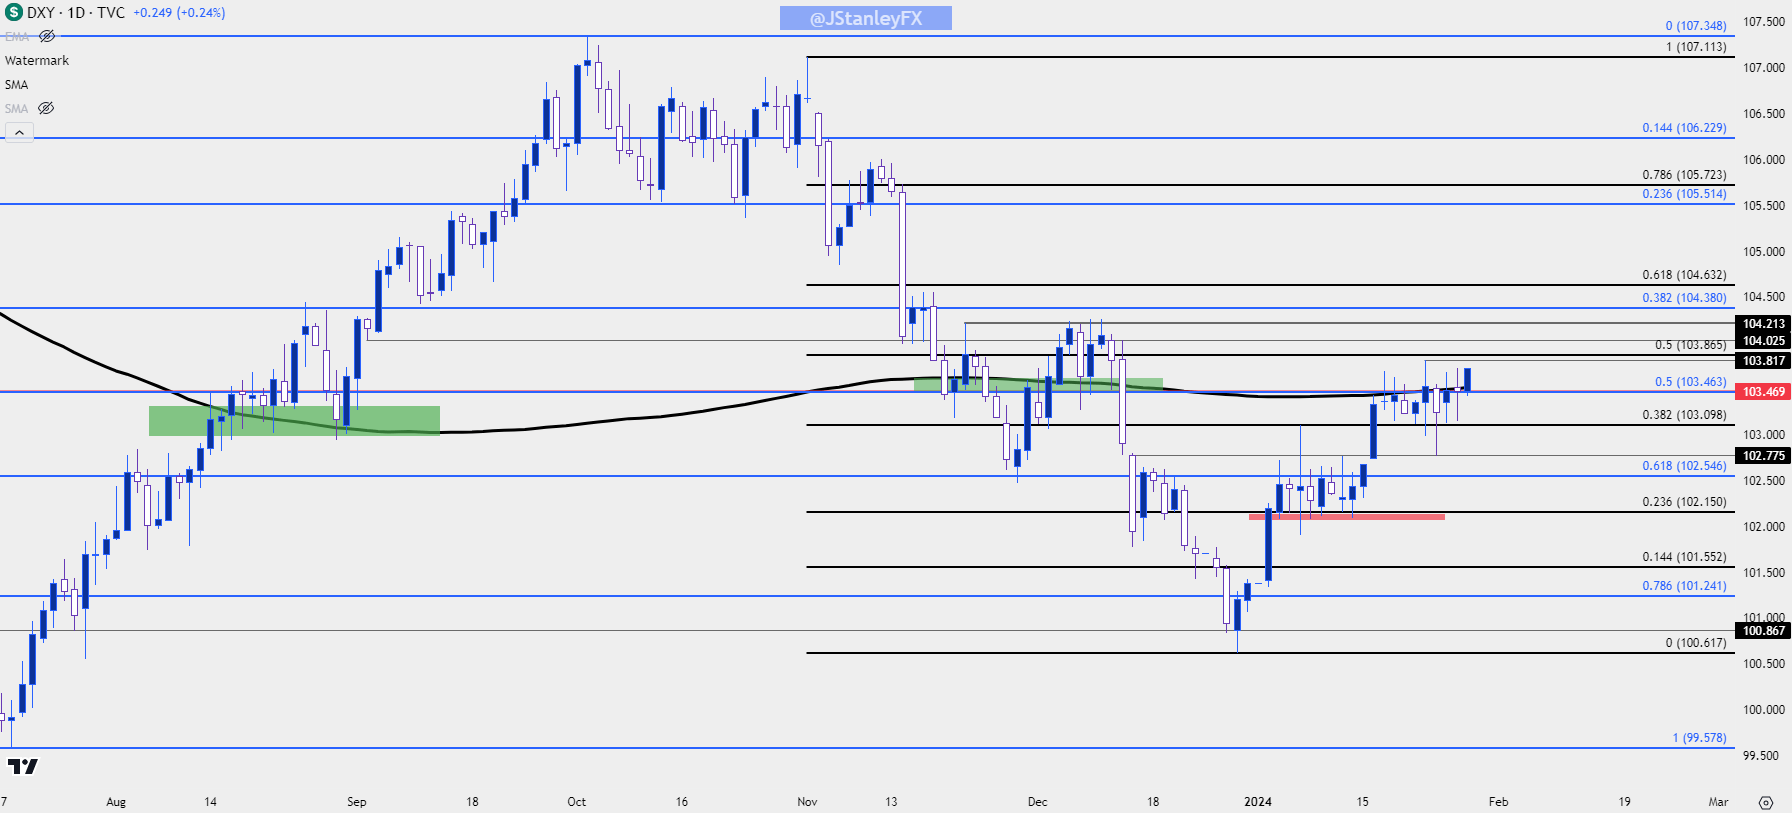 Chart prepared by James Stanley; data derived from Tradingview
As of this writing, buyers are putting in another test above the 200-day moving average in the USD and if this does continue into the Wednesday rate decision, there’s a few spots of note to track for deeper resistance. The 104.21 level is what held the highs ahead of the December meeting, and above that is a Fibonacci level at 104.38.
Above that there’s another Fibonacci level of note at 104.63 and this is the 61.8% retracement of the sell-off that started at November FOMC. The 50% mark of that same study is around current resistance plotted at 103.87.
Below current price, there’s a price swing at 102.78 that held the lows last week, and below that is a key Fibonacci level of prior resistance at 102.55. If bears can push below that then the recent bullish structure would be invalidated, and we might be looking at EUR/USD making a move back towards 1.1000 in that scenario.
U.S. Dollar Four-Hour Price Chart (indicative)
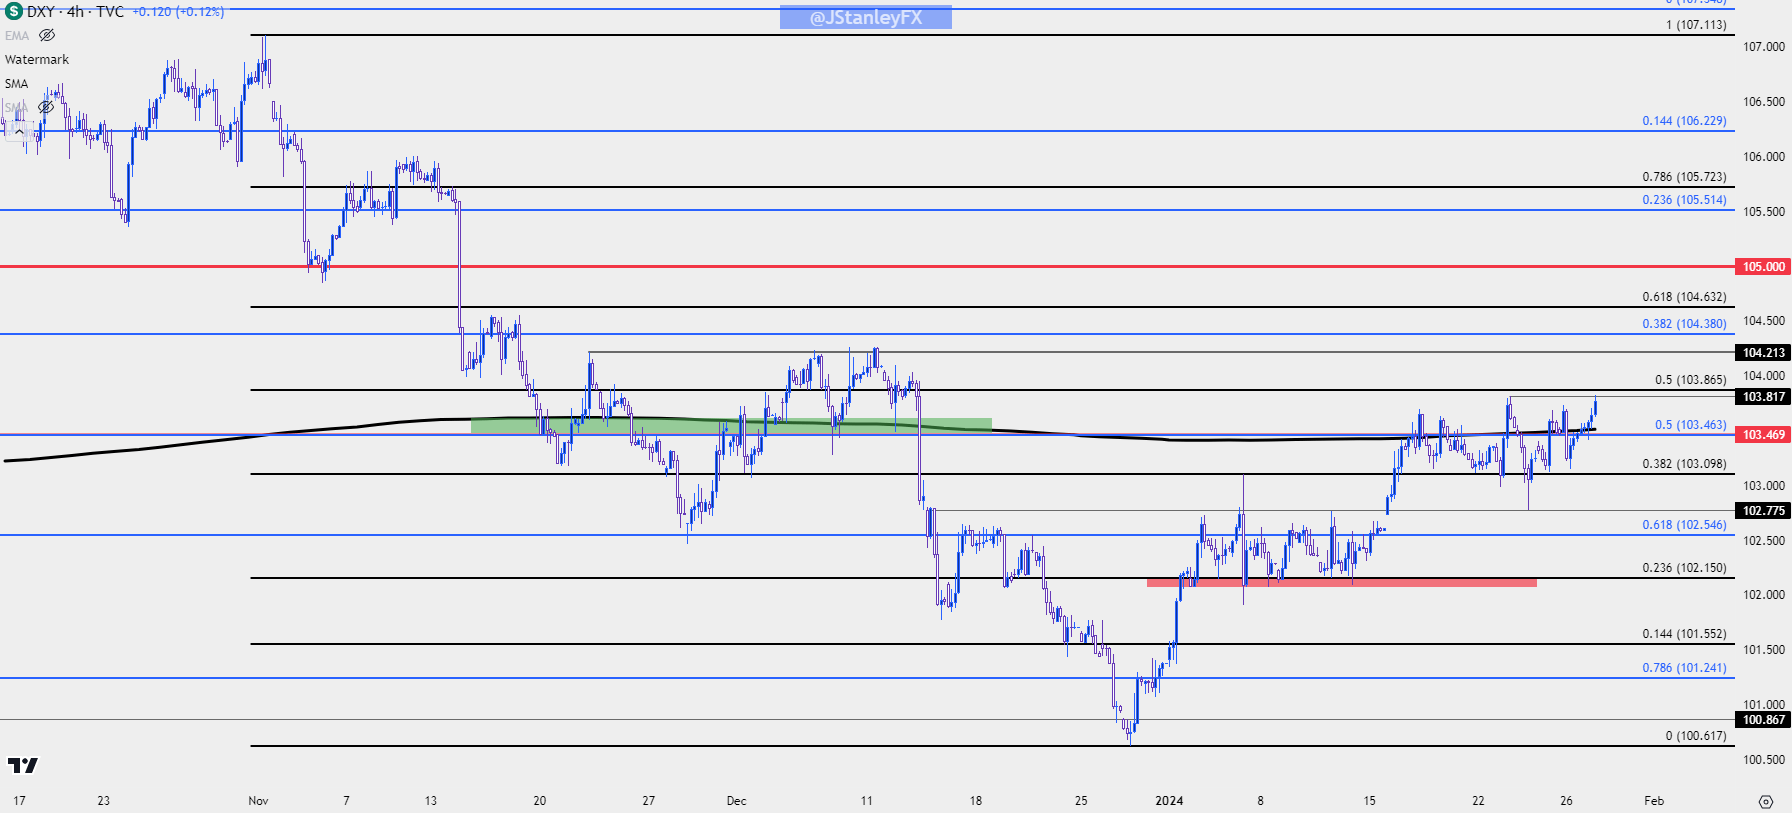 Chart prepared by James Stanley; data derived from Tradingview
EUR/USD
As I had looked at in the background article for the U.S. Dollar last week, the common mechanism for tracking the greenback, or DXY, is merely a composite of underlying currencies. It’s heavily weighted towards the Euro with a 57.6% allocation towards ‘the single currency,’ and this effectively makes the USD vulnerable to European monetary policy more so than any other economy outside of the U.S.
At last week’s ECB rate decision Lagarde again dodged the question of rate cut timing. That’s become a bit more prominent since then, however, with multiple ECB members pointing to the summer for rate cuts to start. EUR/USD is testing below its 200-DMA again, in response.
The big question now is whether Powell will hit the U.S. Dollar again, similar to what showed in November and December.
In EUR/USD there hasn’t yet been a daily close below the 200-dma so far this year. The next spot of support on the chart is a big one, around the 1.0750 psychological level and this is what helped to hold support last December ahead of the December 13th FOMC rate decision and December 14th ECB meeting. The next major zone below that is between two confluent Fibonacci levels plotted from 1.0610 up to 1.0643.
EUR/USD Daily Chart
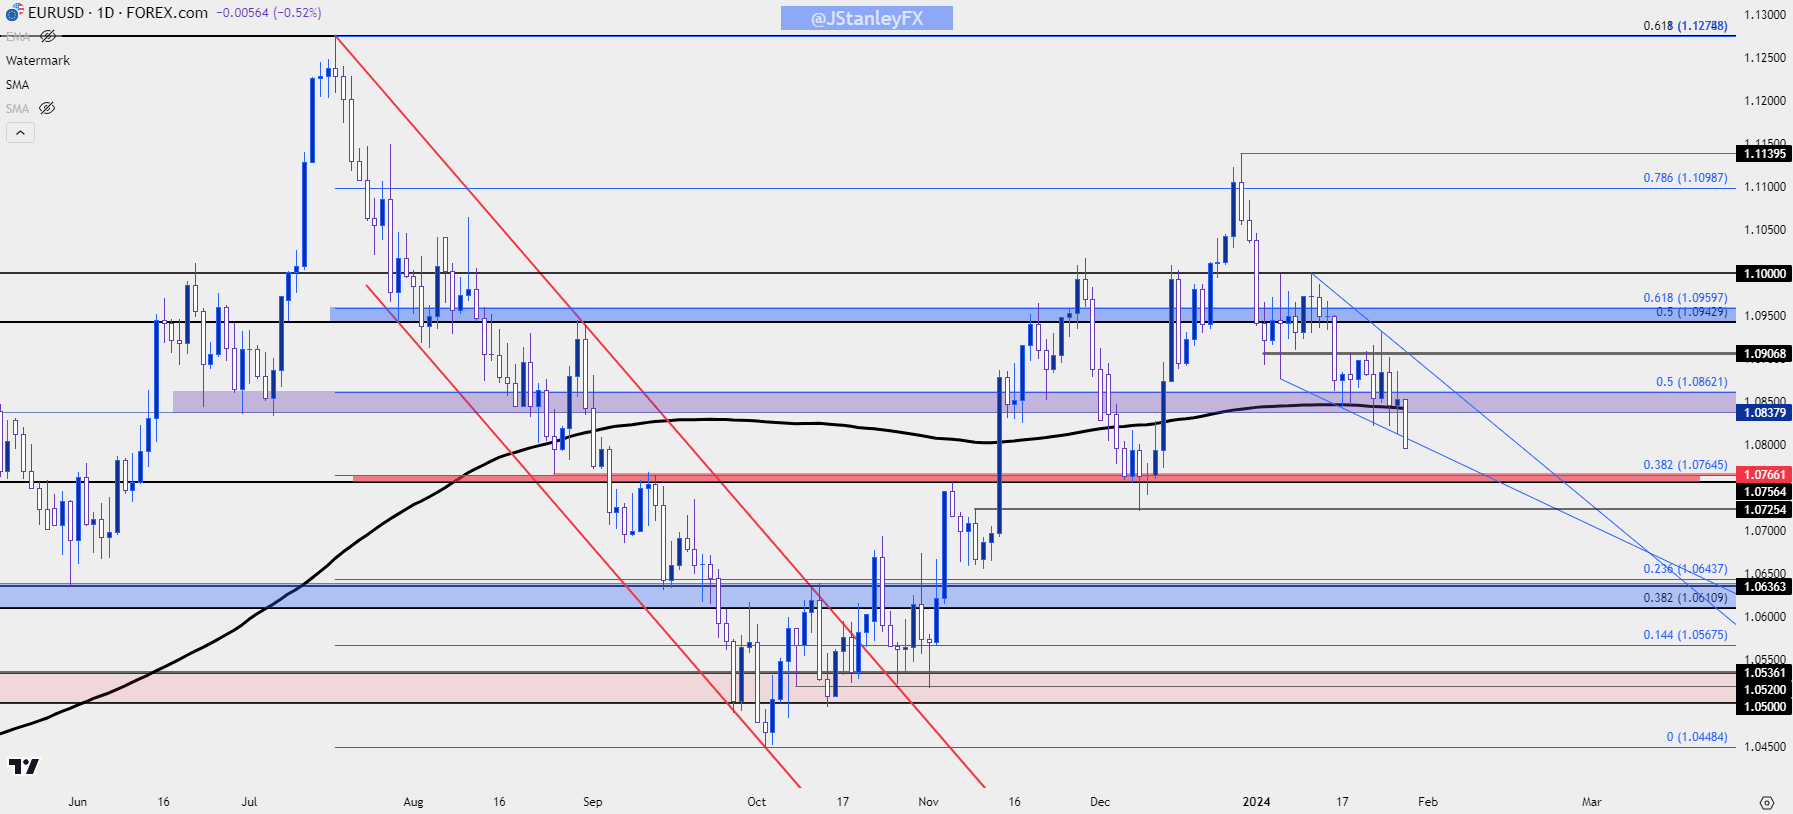 Chart prepared by James Stanley, EUR/USD on Tradingview
USD/JPY
While EUR/USD makes up a whopping 57.6% of the DXY basket, the second largest currency of the Japanese Yen makes up 13.6%. So DXY can certainly highlight Yen-trends but perhaps more pressing in USD/JPY is the longer-term backdrop of the carry trade.
As U.S. rates were jumping higher, Japanese rates remained pegged to the floor, and this brought bulls to the market to push a topside trend that gained more than 50% in the 21 months from the 2021 open into Q4 of 2022. A carry trade of that nature can be beneficial from multiple fronts: The rollover credit that can be earned from the rate differential of the economies in the pair, and as others react to the same thing, this can bring more and more bulls into the market to try to capture that credit. If rates continue to diverge and in this case, they did as the U.S. continued to hike, this can bring more and more bulls into a market until, eventually, you have a crowded trade.
And then once the trade is crowded the slightest hint of reversion could send bulls running for the exits, and that’s precisely what happened on November 10th of 2022 as U.S. CPI came in below expectations. It was still elevated at over 6%, but the fact that it had started to slow down was enough to give bulls reason to close.
It only took three short months for 50% of that prior trend to get wiped away. Support eventually showed at the 50% retracement in early-2023, and bulls started to pile back in throughout the year.
USD/JPY Weekly Price Chart
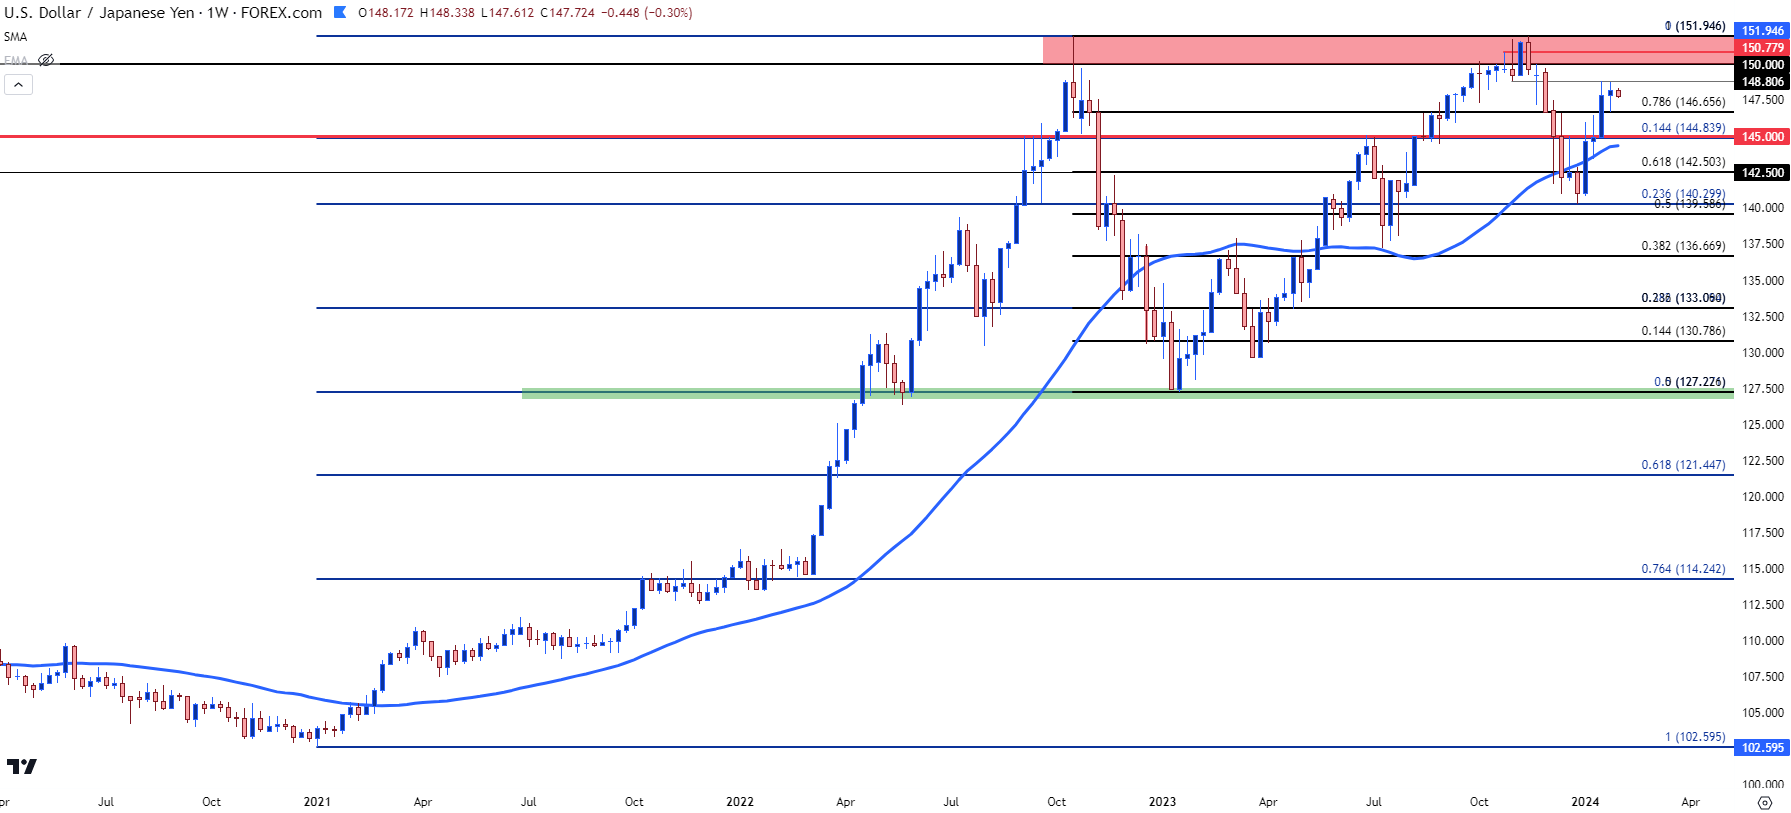 Chart prepared by James Stanley, USD/JPY on Tradingview
It was another November to remember as last November began with the FOMC rate decision on the 1st of the month, which led to a USD pullback; but it was the CPI report released on November 14th that bore resemblance to last year. Again, inflation came in below expectations and this gave rise to the hope that the Fed could get even more dovish with monetary policy.
In USD/JPY, a sell-off began to show after that CPI release and that hastened through the rest of November and into the end of the year. But support showed up on December 28th at a key Fibonacci level of 140.30 and that was enough to hold the lows; and as the door has opened into 2024 bulls have been back on the return.
USD/JPY is now getting very close to the same spot on the chart that’s stalled the advance for each of the past two years.
USD/JPY Daily Price Chart
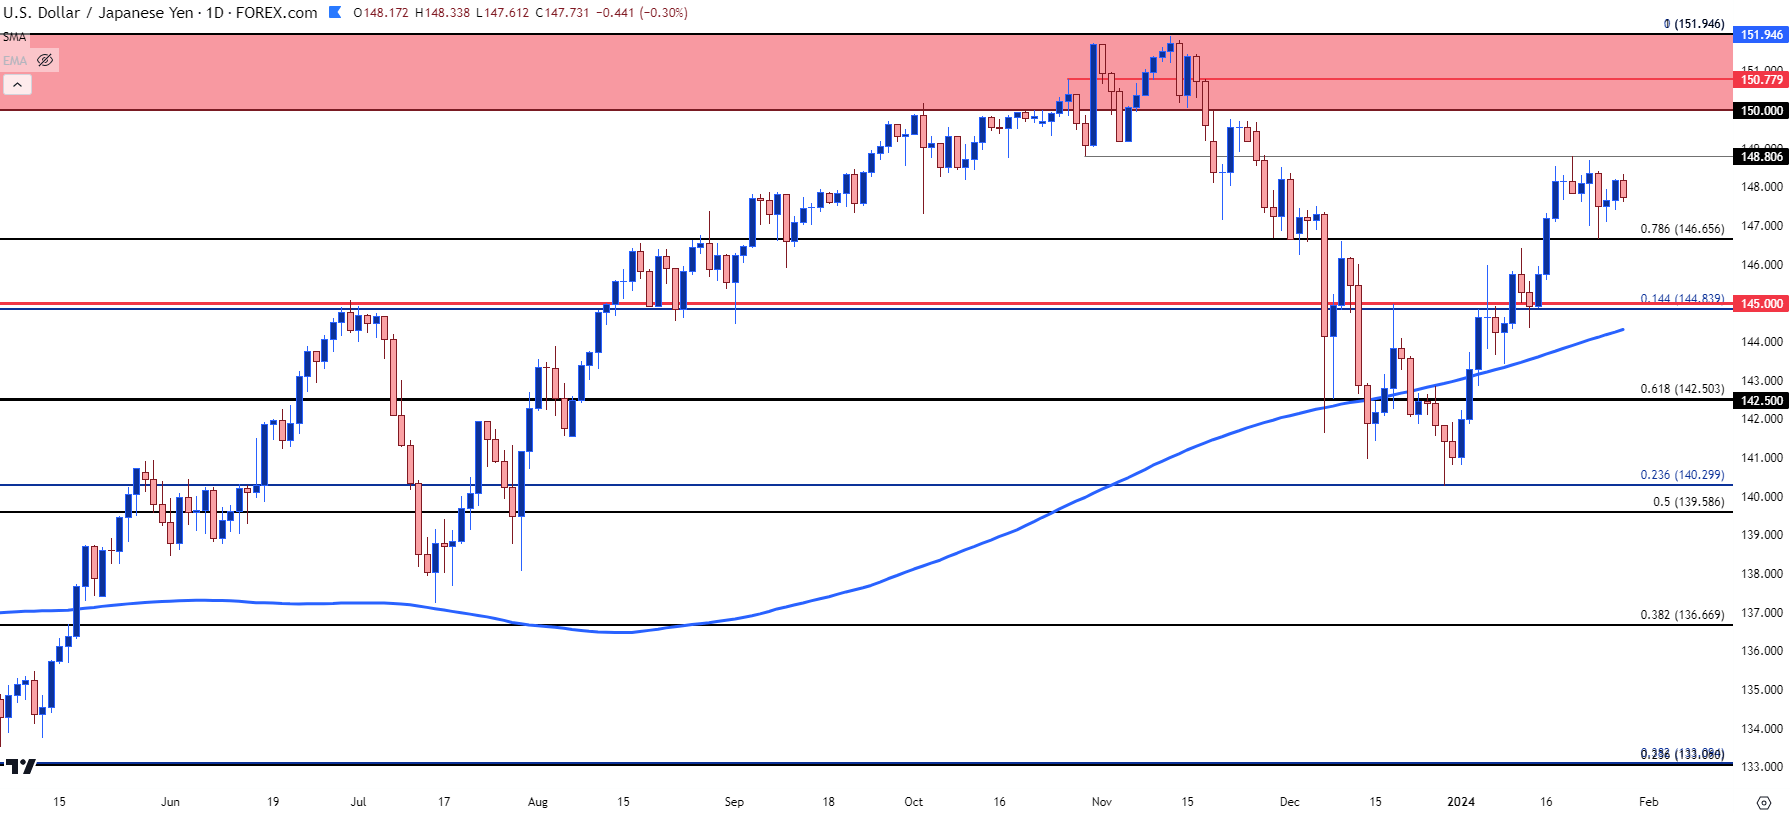 Chart prepared by James Stanley, USD/JPY on Tradingview
USD/JPY Rate Implications
One item to keep in mind is how impactful the carry trade can be across markets, and not just for retail FX traders. This can be a viable trade for hedge funds and the ramifications of this rate divergence can be far-ranging. Notably, there’s been quite the relationship between the 10-year yields referenced at the beginning of this article and the USD/JPY backdrop referred to towards the end. On the below chart, I’ve plotted 10-year yields in orange and USD/JPY spot rates in blue.
If the net from this week is USD-weakness, the potential for carry unwind can fast come back into the picture. But, if its instead USD-strength, the big question will be whether the pair can finally sustain bullish drive above the 150/152 area of resistance that’s held the highs for the past two years.
USD/JPY and 10-Year Treasury Yields – Daily Chart 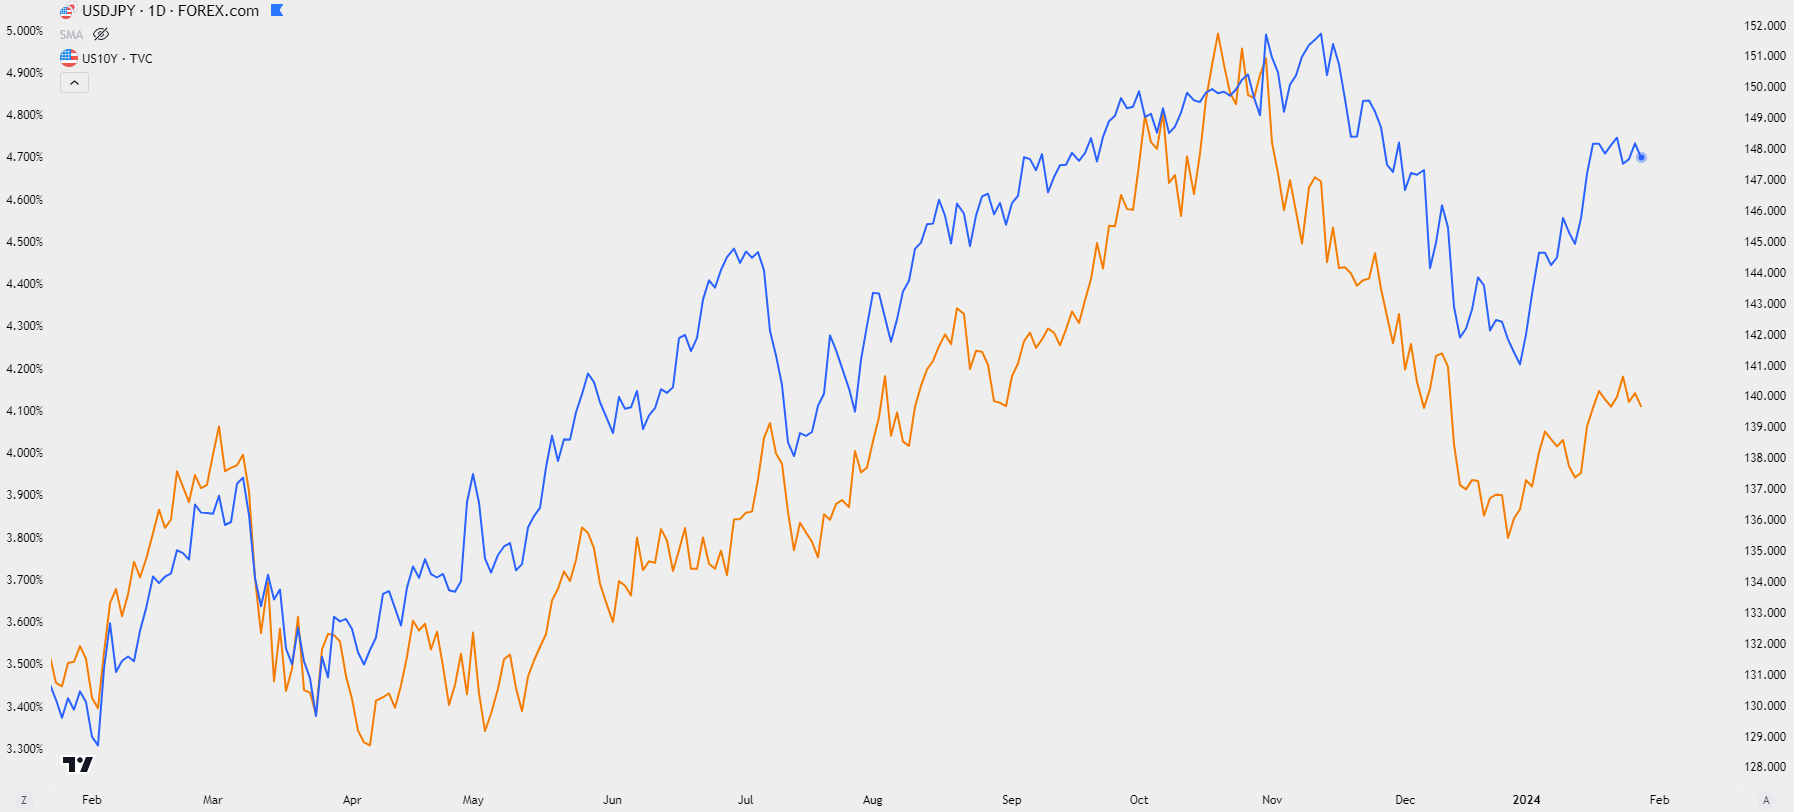
Chart prepared by James Stanley; data derived from Tradingview
--- written by James Stanley, Senior Strategist


