USD/JPY Outlook
USD/JPY tumbles to a fresh weekly low (142.09) following a weaker-than-expected US Non-Farm Payrolls (NFP) print, and the exchange rate may face a larger pullback as the Relative Strength Index (RSI) falls below 70 to reflect a textbook sell signal.
USD/JPY Susceptible to Test of Channel Support amid RSI Sell Signal
USD/JPY trades back within the ascending channel from earlier this year as the US economy adds 209K in June versus forecasts for a 225K print, and it remains to be seen if the update to the Consumer Price Index (CPI) will influence exchange rate as inflation remains above the Federal Reserve’s 2% target.
Join David Song for the Weekly Fundamental Market Outlook webinar. Register Here

Recent remarks from Dallas Fed President Lorie Logan suggest the central bank will implement higher interest rates as the official warns that a ‘more-restrictive monetary policy will be needed to achieve the Federal Open Market Committee’s (FOMC’s) goals of stable prices and maximum employment’ while speaking at the Central Bank Research Association Annual Meeting.
President Logan, who votes on the FOMC this year, went onto say that ‘it is important for the FOMC to follow through on the signal we sent in June,’ and it seems as though Fed officials will continue to prepare US households and businesses for higher interest rates as ‘two-thirds of FOMC participants projected at least two more rate increases this year.’

Source: Cleveland Fed
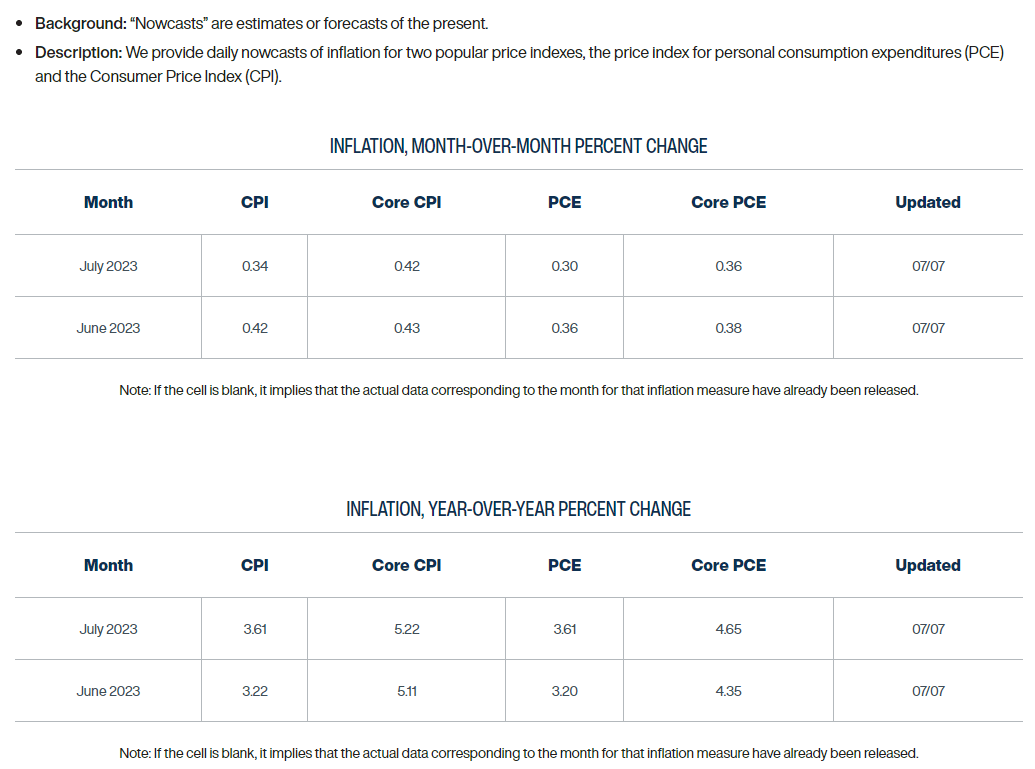
Nevertheless, the update to the US CPI may limit the FOMC’s scope to pursue a more restrictive policy as the Cleveland Fed Inflation Nowcasting estimate shows both the headline and core reading slowing in June, and indications of easing price growing may produce headwinds for the Greenback as it dampens speculation for higher interest rates.
With that said, USD/JPY may threaten the upward trending channel from earlier this year as the Relative Strength Index (RSI) falls back from overbought territory, but the exchange rate may continue to exhibit a bullish trend as the 50-Day SMA (139.77) reflects a positive slope.
Japanese Yen Price Chart – USD/JPY Daily

Chart Prepared by David Song, Strategist; USD/JPY on TradingView
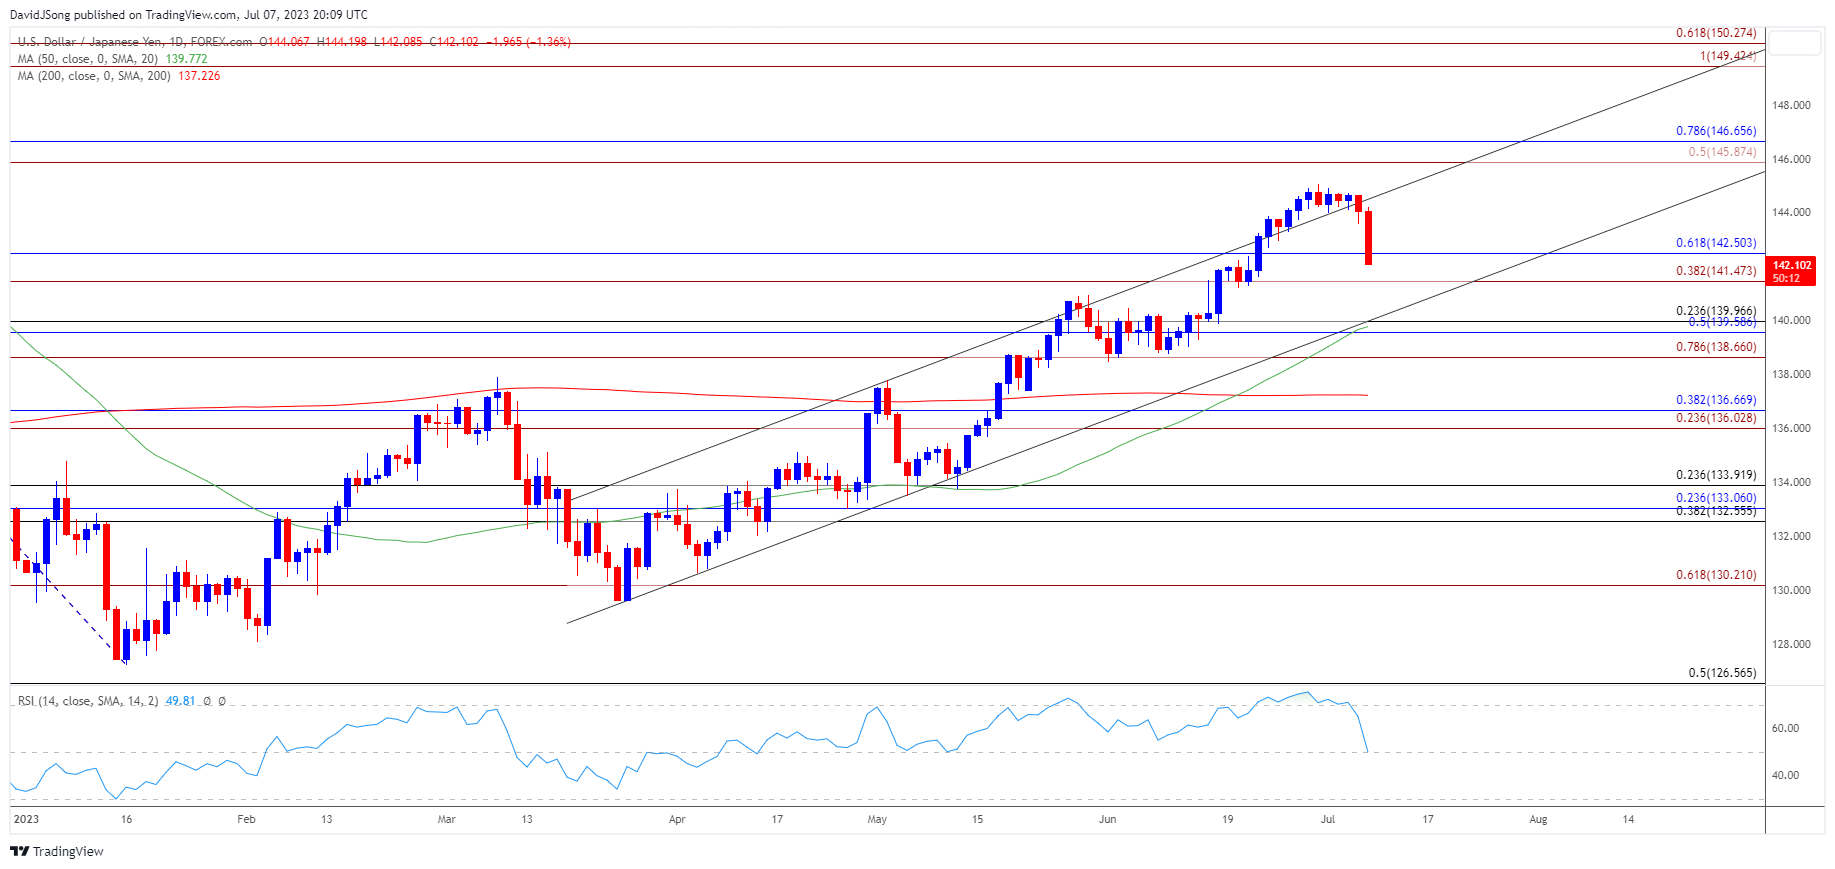
- USD/JPY trades back within the ascending channel from earlier this year after registering a fresh yearly high (145.07) last month, with the exchange rate coming up against the 141.50 (38.2% Fibonacci extension) to 142.50 (61.8% Fibonacci retracement) zone as it tumbles to a fresh weekly low (142.09).
- The recent weakness in USD/JPY has pushed the Relative Strength Index (RSI) below 70 to indicate a textbook sell-signal, and the exchange rate may attempt to test channel support as it continues to fall back from overbought territory.
- A break/close below the 141.50 (38.2% Fibonacci extension) to 142.50 (61.8% Fibonacci retracement) zone opens up the 138.70 (78.6% Fibonacci extension) to 140.00 (23.6% Fibonacci retracement) area, which lines up with the 50-Day SMA (139.77).
- Nevertheless, USD/JPY may respond to the positive slope in the moving average if it holds above the June low (138.44), and lack of momentum to break/close below the 141.50 (38.2% Fibonacci extension) to 142.50 (61.8% Fibonacci retracement) zone may bring the June high (145.07) on the radar as it trades within the upward trending channel from earlier this year.
Additional Market Outlooks:
USD/CAD Climbs Above Former Support to Eye 50-Day SMA
Gold Price Stalls Again at Former Support Zone
--- Written by David Song, Strategist
Follow on Twitter at @DavidJSong


