US Dollar Outlook: USD/JPY
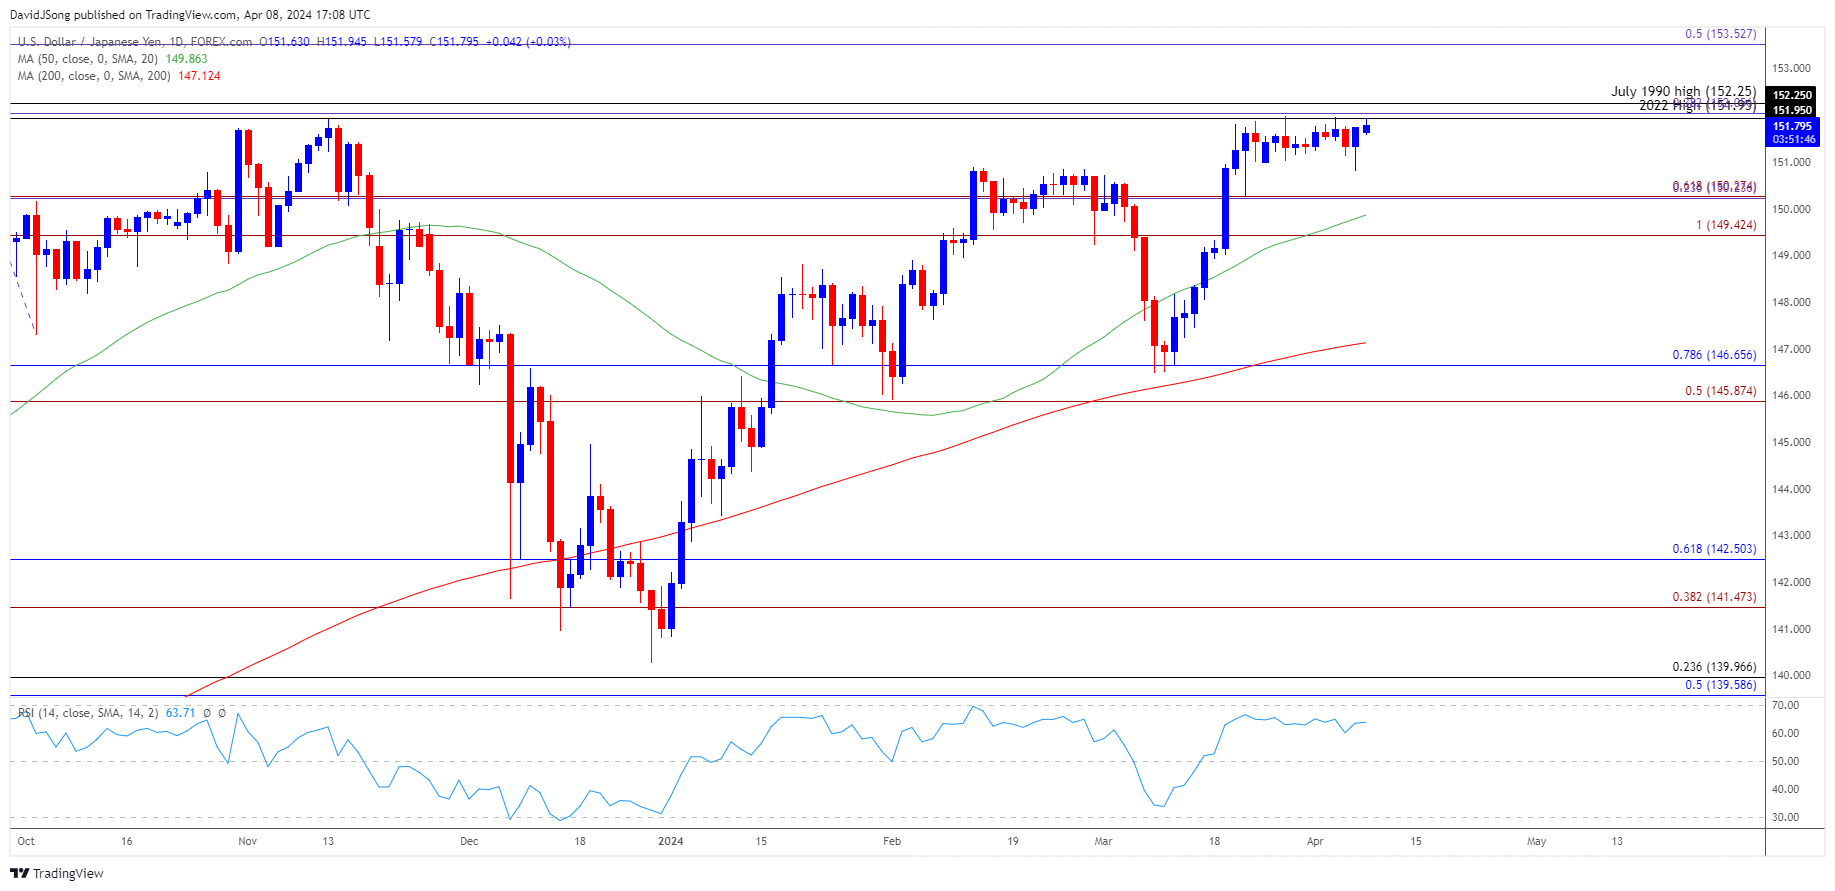
USD/JPY trades near the monthly high (151.97) following the stronger-than-expected US Non-Farm Payrolls (NFP) report, and the exchange rate may stage further attempts to test the July 1990 high (152.25) if it tracks the positive slope in the 50-Day SMA (149.86).
USD/JPY Susceptible to Further Attempts to Test July 1990 High
USD/JPY seems to be trending sideways despite the rise in long-term US Treasury yields, but the different approach in monetary policy may keep the exchange rate afloat as the Bank of Japan (BoJ) shows no intention of pursing a hiking-cycle.
Join David Song for the Weekly Fundamental Market Outlook webinar. David provides a market overview and takes questions in real-time. Register Here
Meanwhile, the Federal Open Market Committee (FOMC) appears to be on track to switch gears as the central bank still forecasts lower interest rates in 2024, but developments coming out of the US may keep the Fed on the sidelines as the committee carries out a data dependent approach in managing monetary policy.
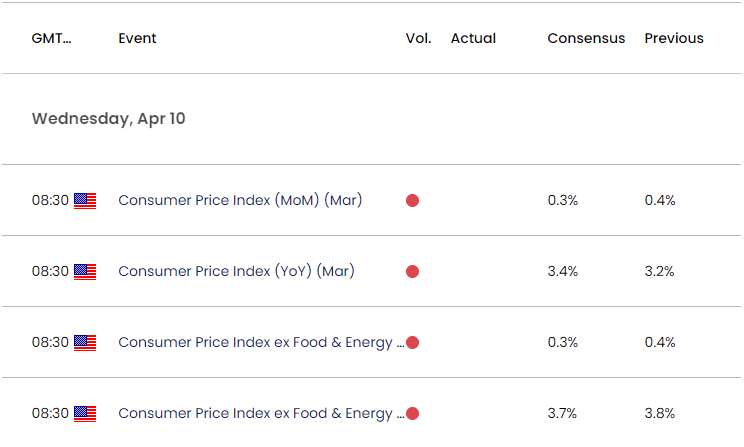
US Economic Calendar

In turn, the update to the US Consumer Price Index (CPI) may sway USD/JPY as ‘the Committee does not expect it will be appropriate to reduce the target range until it has gained greater confidence that inflation is moving sustainably down toward 2 percent,’ and signs of sticky price growth may generate a bullish reaction in the Greenback as it puts pressure on the FOMC to keep US interest rates higher for longer.
At the same time, a lower-than-expected CPI print may produce headwinds for the US Dollar as it raises the Fed’s scope to pursue a less restrictive policy, and USD/JPY may trend sideways ahead of the FOMC rate decision on May 1 as Chairman Jerome Powell and Co. acknowledge that ‘it will likely be appropriate to begin dialing back policy restraint at some point this year.’
With that said, USD/JPY may struggle to retain the advance from the monthly low (150.81) amid the failed attempt to test the July 1990 high (152.25), but the exchange rate may track the positive slope in the 50-Day SMA (149.86) if it continues to hold above the moving average.
USD/JPY Price Chart – Daily

Chart Prepared by David Song, Strategist; USD/JPY on TradingView
- USD/JPY seems to be trending sideways amid the failed attempts to test the July 1990 high (152.25), and the exchange rate may face range bound conditions as it holds above the monthly low (150.81).
- However, failure to defend the 149.40 (100% Fibonacci extension) to 150.30 (61.8% Fibonacci extension) region may push USD/JPY towards the March low (146.48), with the next area of interest coming in around the February low (145.90).
- At the same time, USD/JPY may stage further attempts to test the July 1990 high (152.25) if it tracks the positive slope in the 50-Day SMA (149.86), with the next region of interest coming in around 153.50 (50% Fibonacci extension).
Additional Market Outlooks
US Dollar Forecast: USD/CAD Selloff Eyes March Low
US Dollar Forecast: EUR/USD Bounces Back Ahead of February Low
--- Written by David Song, Strategist
Follow on Twitter at @DavidJSong


