USD/JPY Outlook
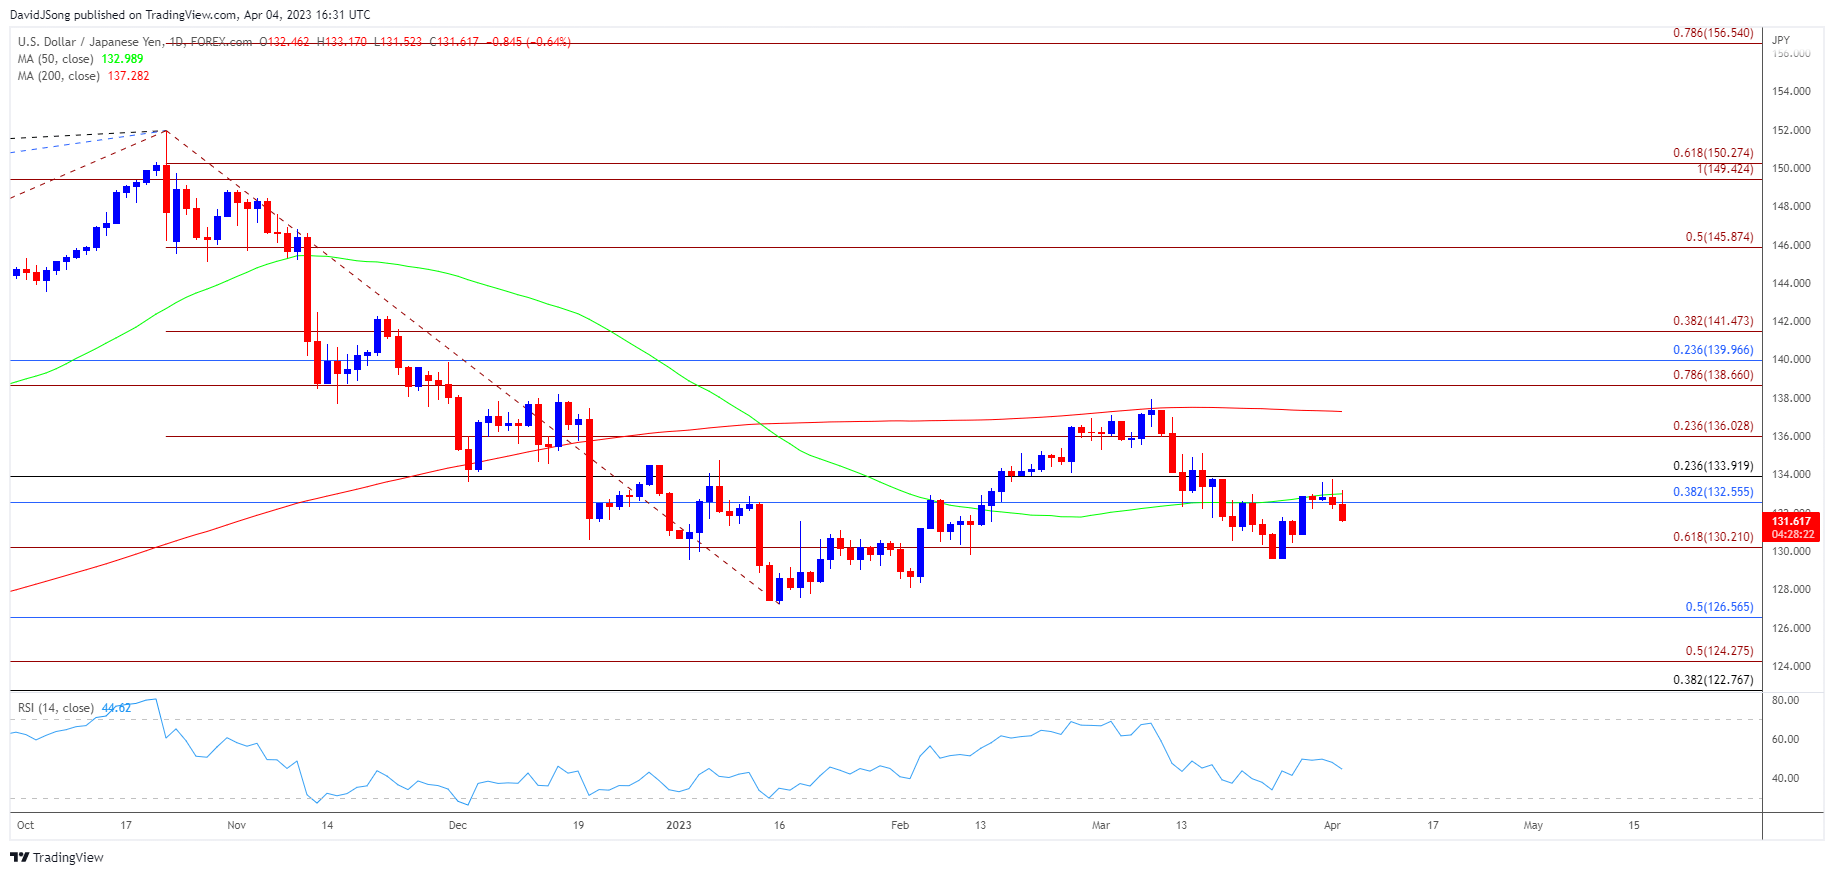
USD/JPY came under pressure after failing to test the December 2022 high (138.18), and the exchange rate may give back the rebound from the March low (129.65) as it struggles to trade back above the 50-Day SMA (132.99).
USD/JPY struggles to trade back above 50-Day SMA ahead of NFP
USD/JPY slips to a fresh weekly low (131.52) amid the renewed weakness in US Treasury yields, with the exchange rate initiating a series of lower highs and lows as the JOLTS Job Openings report shows 9.931M vacancies in February versus forecasts for a 10.400M print.
Join David Song for the Weekly Fundamental Market Outlook webinar. Register Here

Signs of a slowing economy may continue to produce headwinds for the Greenback as the Federal Reserve appears to be at or nearing the end of its hiking-cycle, and it remains to be seen if the update to the US Non-Farm Payrolls (NFP) report will encourage the Federal Open Market Committee (FOMC) to pursue a more restrictive policy the economy is projected to add 240K jobs in March.

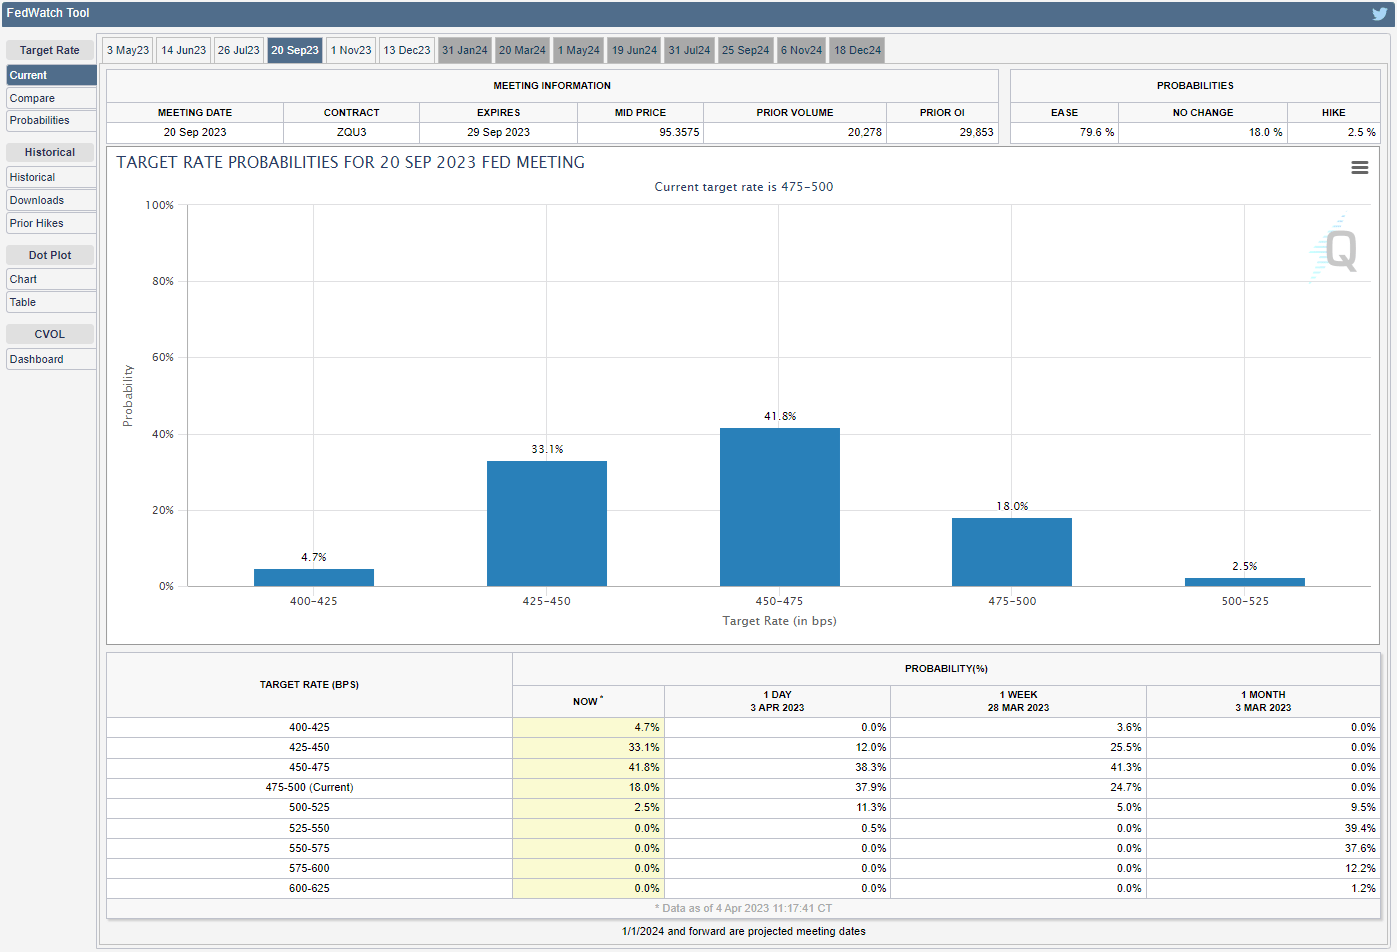
Source: CME
Evidence of a robust labor market may encourage the FOMC to further combat inflation as St. Louis Fed President James Bullard insists that US interest rates need to ‘get over 5%’ during an interview with Bloomberg News, but a below-forecast NFP print may keep USD/JPY under pressure as the CME FedWatch Tool currently reflects growing expectations for a rate cut in the second half of 2023.
Until then, swings in carry-trade interest may sway USD/JPY as the improvement in investor confidence props up global equity prices, and the exchange rate may continue to share a positive relationship with US yields as the Bank of Japan (BoJ) seems to be in no rush to switch gears.
With that said, USD/JPY face a further decline ahead of the US NFP report as it initiates a series of lower highs and lows, and the exchange rate may continue to give back the rebound from the March low (129.65) amid the string of failed attempts to trade back above the 50-Day SMA (132.99).
Japanese Yen Price Chart – USD/JPY Daily

Chart Prepared by David Song, Strategist; USD/JPY on TradingView
- USD/JPY reversed course after failing to test the December 2022 high (138.18), and the exchange rate may give back the rebound from the March low (129.65) as it struggles to trade back above the 50-Day SMA (132.99).
- Failure to hold above 130.20 (61.8% Fibonacci extension) raises the scope for a test of the March low (129.65), with the next area of interest coming in around the February low (128.08).
- However, USD/JPY may stage further attempts to push above the 132.60 (38.2% Fibonacci retracement) to 133.90 (23.6% Fibonacci retracement) region if it holds above the March low (129.65).
--- Written by David Song, Strategist
Follow me on Twitter at @DavidJSong


