
JPY Talking Points:
- The Bank of Japan intervened after the US CPI release earlier in July, and despite a trendline bounce in USD/JPY shortly after, price action has continued to take on an increasingly bearish tone ever since.
- I looked into the EUR/JPY breakdown in yesterday’s webinar and that move has deepened, along with larger breakdowns in the major of USD/JPY and aggressive moves in GBP/JPY and AUD/JPY.
- The big question now is whether carry unwind is unfolding before us. As expectations for rate cuts in the US increase, the attractiveness of the carry trade decreases, which could lead to longs exiting as driven by fear of possible principal losses. And like we saw in Q4 of 2022 and 2023, market participants are often unwilling to wait around, and carry unwind themes can re-price markets very quickly.
It's been almost two weeks since the last release of CPI data in the US, and the major takeaway since for FX markets has been a behavioral change in USD/JPY.
While the data printed below expectations, increasing the probability of sooner rate cuts in the US, it was the Bank of Japan intervention from that morning that really put a stamp on the matter, pushing the pair back-below the 160.00 level in USD/JPY. Initially, support showed at a bullish trendline taken from December and March swing lows, and there was a minor bounce that held into the next week.
But then last Wednesday saw another aggressive sell-off and this time the trendline was breached. The bounce from that held support around prior resistance, and over the past three days bears have made an even firmer push down to fresh two-and-a-half month lows.
USD/JPY Daily Price Chart
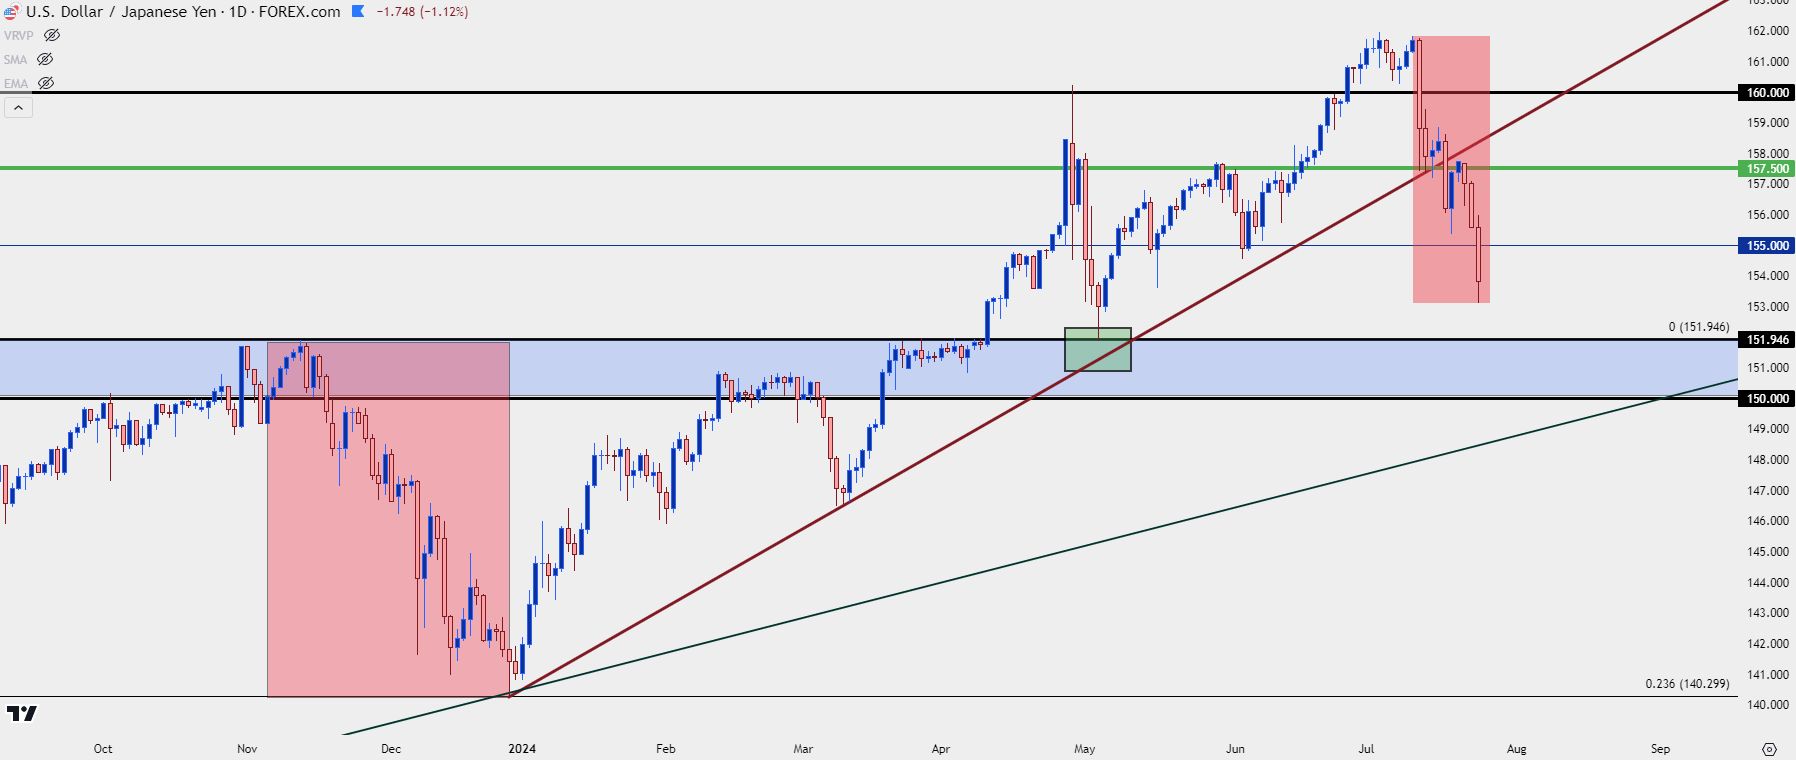 Chart prepared by James Stanley, USD/JPY on Tradingview
Carry Trade/ Carry Unwind
The FX market has a few unique points but perhaps one of the more attractive is the prospect of carry trades. With two economies represented in each FX pair, there’s an associated interest rate in each. The difference between those rates can filter through the pair as a daily credit or debit known as ‘rollover.’ If one economy has a high interest rate while the other has a low interest rate, that divergence can lead to positive carry with a bias towards the higher-rate economy. And also of interest, the other side of the pair can have negative rollover, meaning traders are in a position where they have to pay this rollover on a daily basis.
This would be like a dividend or interest payment, but it’s calculated on a daily basis. And while it may not sound like much, this is accounted for on the full size of the trade, not the margin; so, traders can essentially use leverage to increase rollover credits or debits.
But perhaps the more attractive part of this theme isn’t with the rollover itself, but what the rollover can do to markets. With positive rollover on the long side and negative rollover on the short side, there’s a built-in incentive for longs to buy and a built-in drawback for bears to short. This can lead to strong and relatively consistent trends, such as we saw in USD/JPY in 2021 and 2022 when the pair gained 48.1% in around 21 months. And for buyers that were riding that trend-higher, they were also earning daily rollover given the increasing rate divergence between the U.S. and Japan.
This was front-and-center in the fundamental analysis section of the Trader’s Course, which you can watch in full from the below video player. And if you'd like more information about the full curriculum, that's available at the following link: The Trader's Course, from FOREX.com.
Fundamentals in the FX Market: Part One of the Trader’s Course
When the carry trade is in force, it can be a beautiful thing as traders can earn daily rollover while also riding the trend as produced by the impact of that rate divergence. This explains the weekly chart of USD/JPY since the 2021 open where prices gained as much as 57.86% up the high of a few weeks ago.
The year of 2021 saw growing inflation in the US and despite the Fed saying that it was ‘transitory,’ the market continued to price in greater probability of eventual rate hikes, leading to USD strength. The trend ballooned in 2022 as the Fed actually began to hike rates and this was driven by an even larger rate differential and even larger rollover amounts on the long side of the move.
USD/JPY Weekly Price Chart
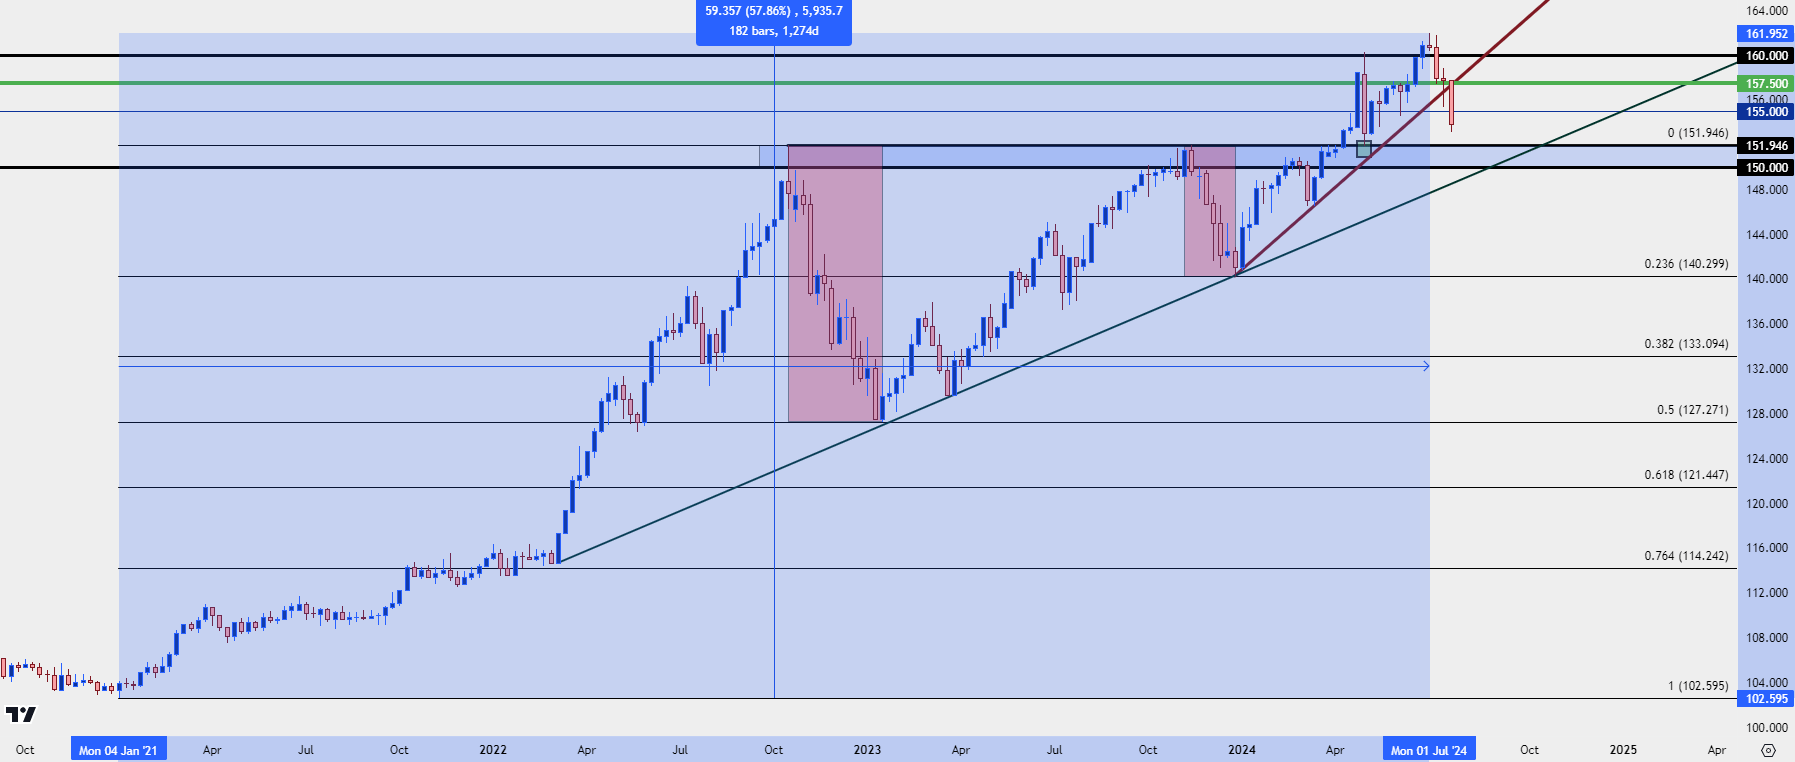 Chart prepared by James Stanley, USD/JPY on Tradingview
‘The Red Sections’
While carry trades can be beautiful backdrops for traders to work with, we’re still talking about markets so there will remain an element of unpredictability. And there’s a very good lesson in here about the impact of market sentiment.
As trends build and more and more traders jump on to one side of the trade, there’s fewer traders on the sideline that could potentially come-in to continue the push higher. I think of this as: ‘Anyone that could want to get long, probably already is.’ Eventually, that trade will become incredibly one-sided, with longs that have already bought. This in-and-of-itself isn’t necessarily a bearish factor, but it brings up the ‘smelling smoke in a crowded movie theater’ analogy, where the slightest hint of change could compel that one-sided trade to start to unwind. And as traders begin to sell, driving lower prices, more longs are encouraged to jump ship, leading to even more supply in the market which then creates even lower prices, despite any fundamental drives that may be present on the other side of the trade.
We saw this in Q4 of 2022 in USD/JPY. That started with an intervention from the Bank of Japan, devised to defend the 150.00 spot level in USD/JPY. That backed bulls down for a few weeks, but it was the US CPI print released on November 10th of that year that prodded bulls to close positions, as there was a growing fear that the Federal Reserve would respond to slowing inflation by moving into a more-dovish mode.
It only took three months for that trend to erase half of what had taken 21 months to build. And the carry was positive on the long side and negative on the short side throughout; but that mattered little as this was more of a sentiment item as a crowded trade was unwinding, as longs feared for larger and larger principal losses despite the still-positive carry.
Support eventually showed at the 50% mark of that prior major move in January of 2023. At that point, quite a few longs had exited and there was capital back on the sidelines. The carry was still positive as the Fed was continuing to look at rate hikes and the Bank of Japan hadn’t yet moved off of their uber-loose monetary policy.
Bulls returned and that drew more buyers in, as there was, again, the prospect of positive rollover for holding long and now, after three months of reversion, a growing prospect of bullish trends.
It took ten months for USD/JPY to go right back to where it had topped previously, at the 152.00 handle. The Japanese Finance Ministry started to opine again, threatening intervention to defend the currency at the same spot that they had intervened a year prior.
In that episode they didn’t even need to intervene as it was another below-expected CPI report that helped to drive a pullback. But, this time, there was also growing probability of Fed rate cuts in the coming year so bulls that had been holding on had even more reason to realize profits, exit, and then wait for the next setup.
This time, the pullback only lasted for about six weeks and accounted for 23.6% of the prior move. Support showed in late-December and what happened earlier in the year started to happen again, as bulls returned in droves to re-take control of the trend.
USD/JPY Daily Price Chart
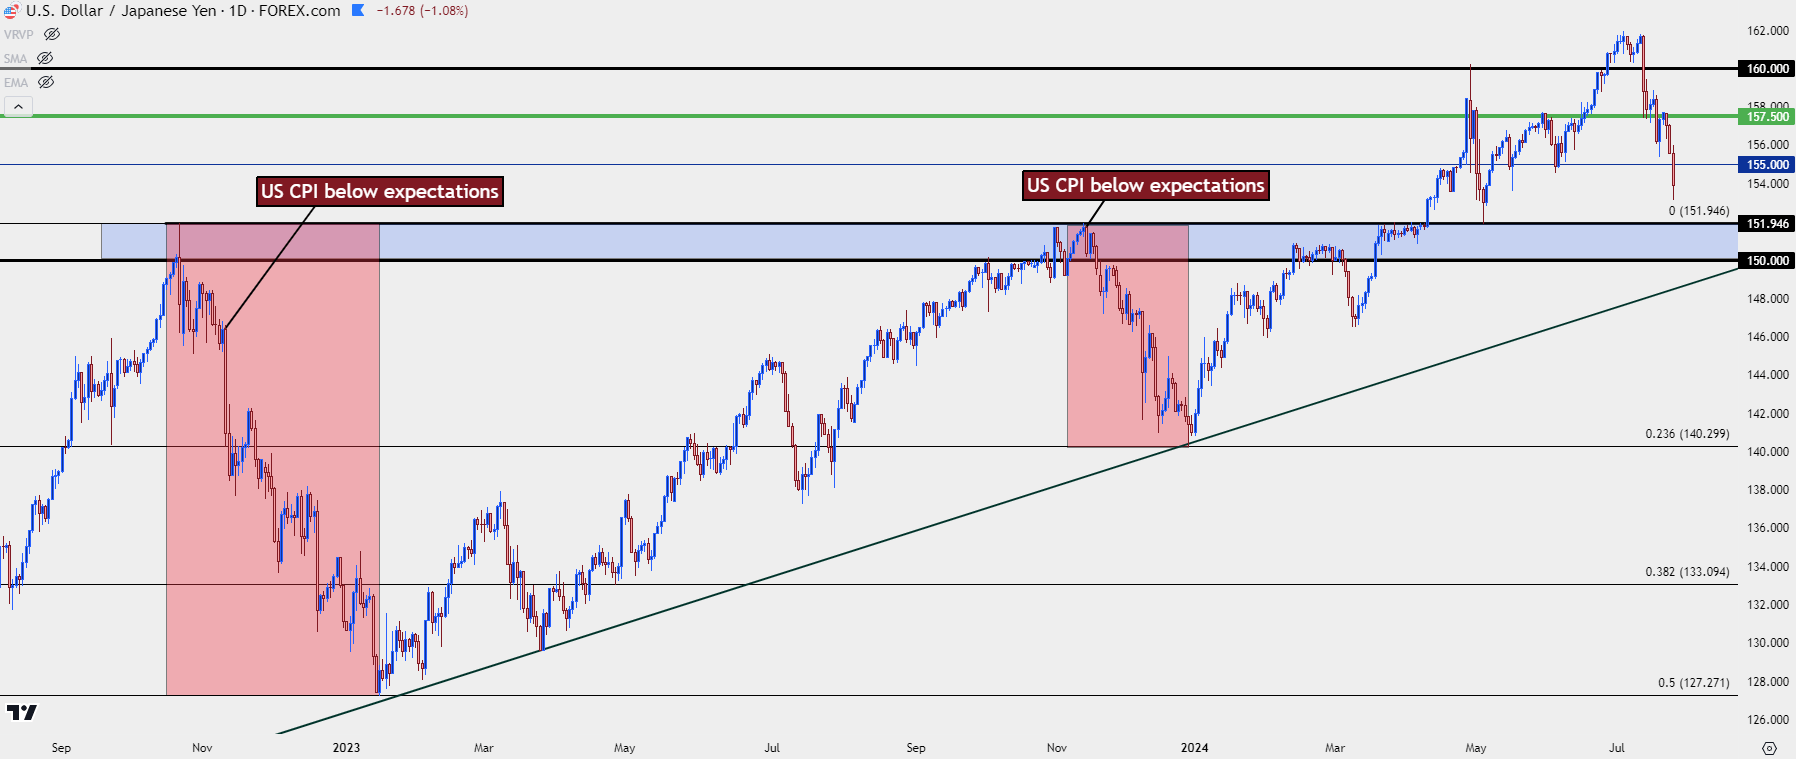 Chart prepared by James Stanley, USD/JPY on Tradingview
USD/JPY Fresh Highs
The April breakout in USD/JPY was, once again, driven by US CPI. This time the data was going the other way as inflation had printed above-expectation and there was a growing fear that the Fed would not be able to cut interest rates in 2024.
I had explained this backdrop ahead of the move, warning that there were likely a lot of stop orders for short positions sitting above that 152.00 level, which had already been defended by the Bank of Japan. And stop orders on short positions are ‘buy to cover’ logic, often executed ‘at best,’ which means that it could continue to drive demand even as prices move-higher. After all, the nature of a stop order is to get out of the trade regardless of price, right? Well, this can work in short squeeze scenarios, too, and that episode produced a strong breakout that continued to run for the rest of April, until the pair eventually traded above the 160.00 handle for the first time since 1989.
USD/JPY Daily Chart
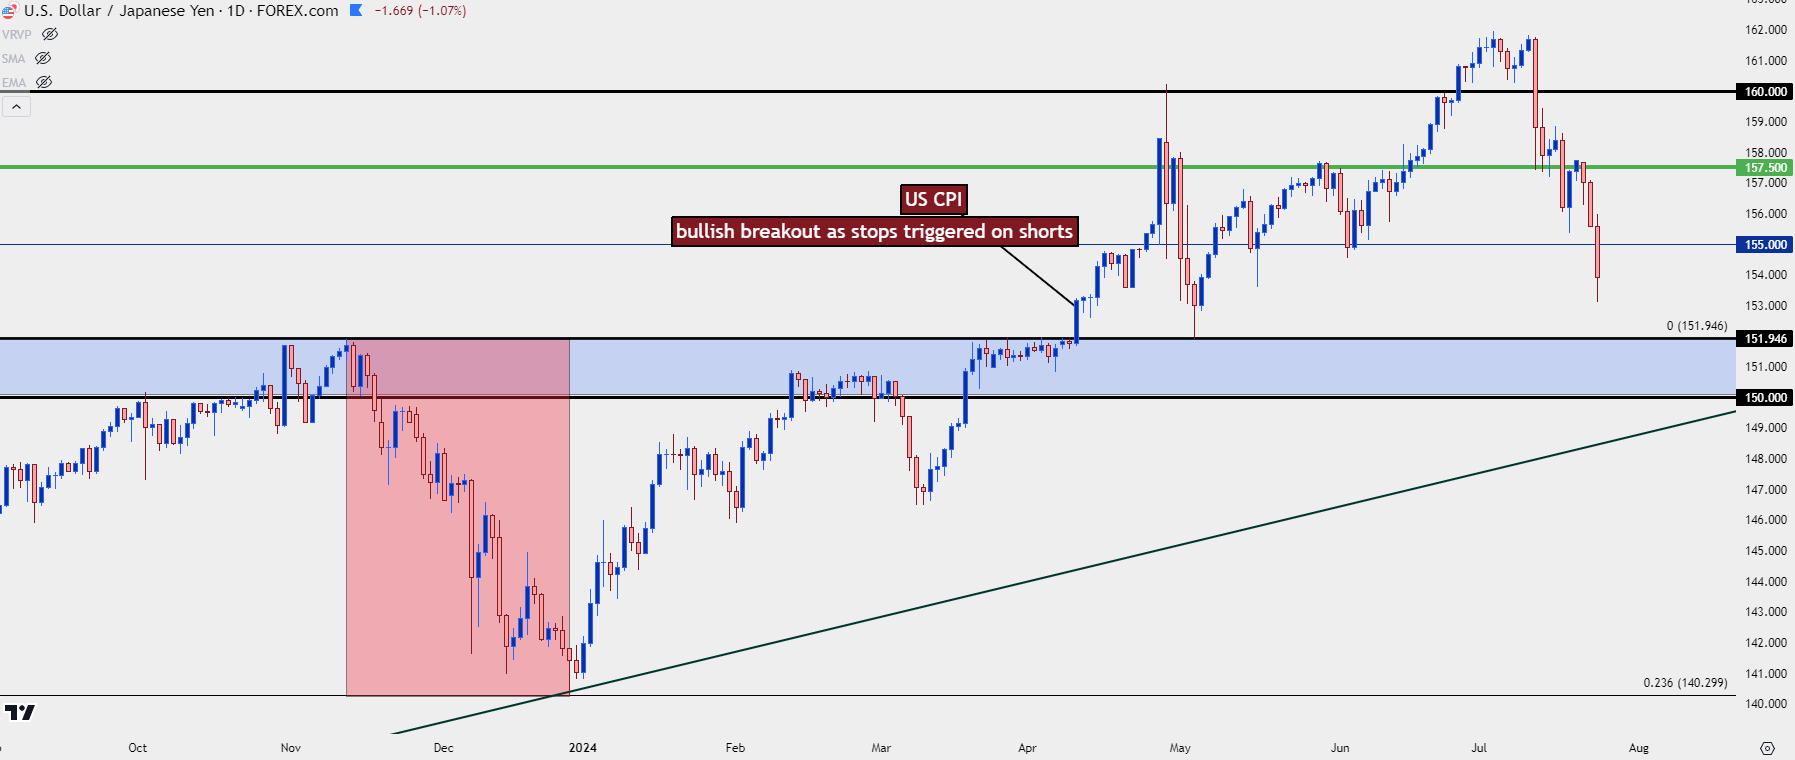 Chart prepared by James Stanley, USD/JPY on Tradingview
BoJ Intervention in 2024
After a couple of weeks of strength in USD/JPY following that breakout at 152, the Bank of Japan intervened after USD/JPY first touched the 160.00 level. The initial move was forceful, drawing a pullback to test below 155.00. There was an FOMC meeting that week and in the aftermath of the press conference, USD/JPY had held strength and was threatening a return trip to 160.00.
That’s when the BoJ intervened again and this time, they slammed the pair. Sellers ran for a couple days after until, eventually, support showed at the same spot of prior resistance of 152 on the morning of Non-farm Payrolls. That held the lows into the end of the week and when the next week opened for trade, bulls were, once again, off and running.
It took almost two full months for the pair to recover to the same 160.00 level that had been previously defended, but this was the same drive seen after pullbacks in Q4 of 2022 and 2023. Bulls were following the still-positive carry on the long side and bears were deterred by the negative carry on the short side, so the bullish bias remained.
But – much like we saw in April and early-May, these counter-trend episodes aren’t necessarily direct drivers into doom-and-gloom. The bigger test is going to be whether bulls come into defend those support levels as driven by the still-positive carry on the long side of USD/JPY. This puts even more focus on 150 and 152.
USD/JPY Four-Hour Price Chart
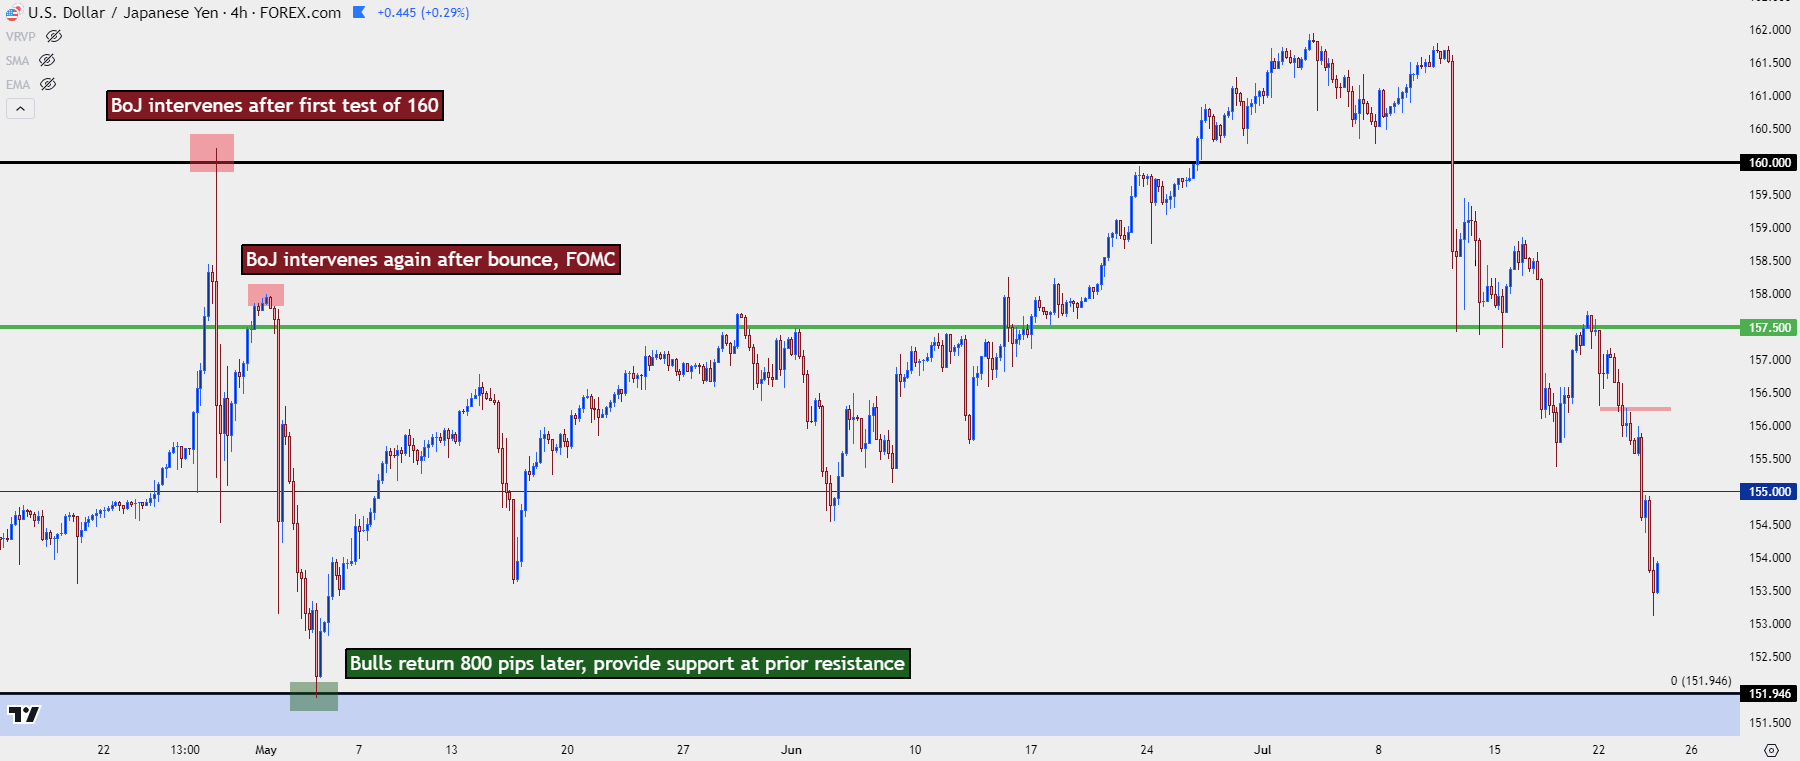 Chart prepared by James Stanley, USD/JPY on Tradingview
Carry and Correlations
At this point, given the drive of lower inflation leading to higher rate cut potential, which then provides greater motive for USD/JPY carry trades to unwind, the link can be made between US economic performance and USD/JPY. The worse the US economy looks, the greater that drive for long USD/JPY positions to unwind
The BoJ watched carefully, however, and they hatched a plan to make another entrance into markets. This time, however, they were carefully trained on the US CPI data set to come out earlier in July and it was mere minutes after that data was released that another intervention was ordered.
This was an impactful move that pushed USD/JPY down to a test of the 157.50 psychological level, which held for a couple of days and led to a minor bounce. But it was the next Wednesday (last Wednesday, as of this writing) that another swell of selling appeared.
The pullback from that held resistance at prior support, around the same 157.50 level, and sellers have pushed again to set another fresh near-term low. At this point we have a continuation of lower-lows and lower-highs on the daily chart and sellers have been getting even more aggressive, as shown by the increasingly-bearish lean from the trendlines below, produced from the past week of price action.
USD/JPY Hourly Chart
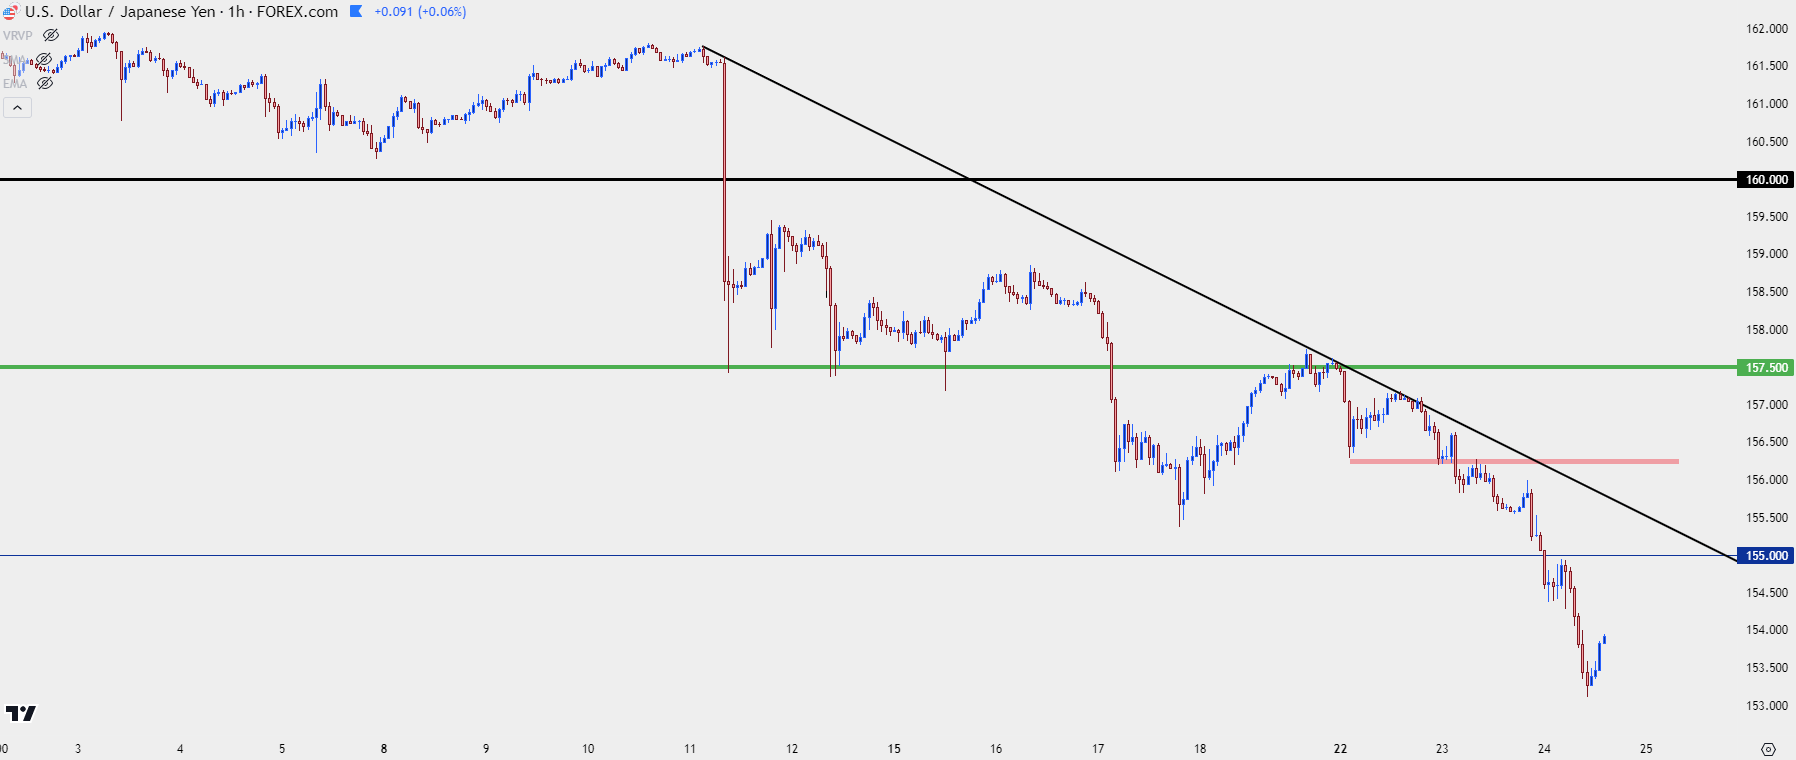 Chart prepared by James Stanley, USD/JPY on Tradingview
So, Is the Carry Dead?
It seems that we’re witnessing carry trades unwinding at a brisk pace right now, and if we draw back to that past CPI report we can see a reason as to why. With US inflation continuing to slow and with the Fed expected to cut three times in their final three meetings of the year, the attractiveness of the rate differential that’s driven the move is getting less and less so. On top of that, given the proximity to recent 37-year highs, there’s still a lot of longs holding on to the trade, and as prices drop further, the incentive to realize profits and get out of the trade increases even more.
And much like we saw with the bullish breakout in April, market participants will often use inflection points for stop placement: As in, if traders have placed stops on long positions just below the 150.00 level, then a breach of that price could trigger a host of sell orders as that supply comes into the market. That could further contribute to deeper breakdowns as longs that have been riding the carry close positions, fearing for larger principal losses.
This puts closer focus on to US data points, such as the Core PCE release set for Friday. With more signs of inflation slowing, there can be even higher probabilities of near-term rate cuts, perhaps even with a possible cut at next week’s FOMC meeting entering into the equation. That could provide further motive for long-term carry trades to unwind, with places even more pressure on the downside of USD/JPY.
It’s important to remember the big picture, however, and what we’ve seen so far is a small pullback in a larger bullish backdrop. So, it’s too early to claim with any degree of certainty that USD/JPY has topped and that bears are going to drive a reversion back to 140 or 120. For those scenarios to be entertained, more data is going to be required but if those data points do fall in a particular way, the sell-off could be severe as we witness ‘up the stairs, down the elevator’ like price action.
USD/JPY Monthly Price Chart
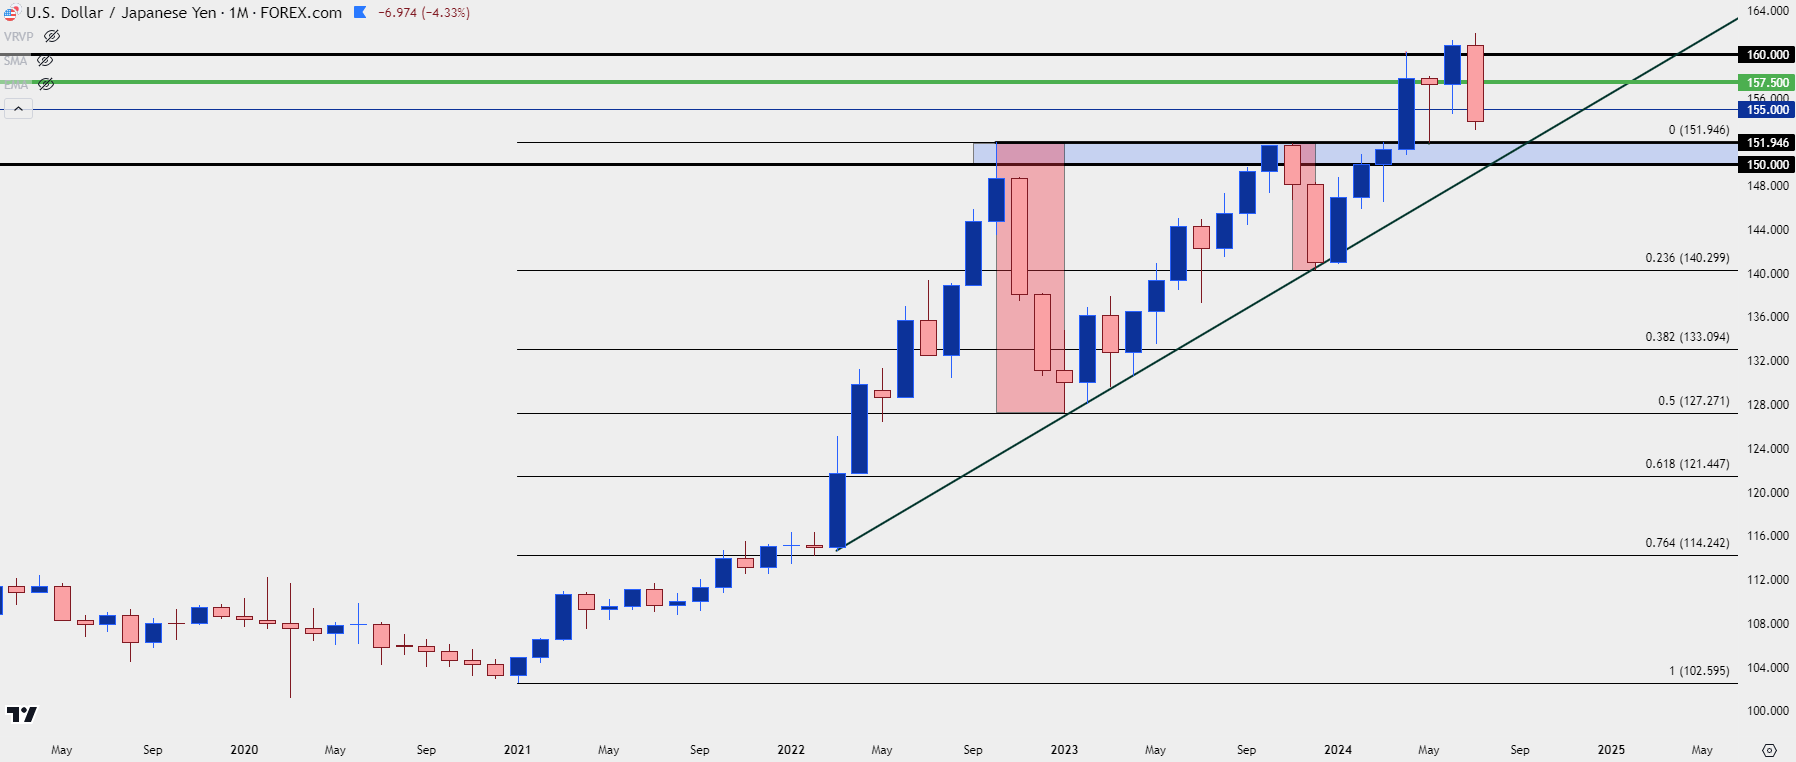 Chart prepared by James Stanley, USD/JPY on Tradingview
--- written by James Stanley, Senior Strategist


