
USD/JPY, Nasdaq, S&P 500 Talking Points:
- The past two weeks have seen some of the markets most dominant trends face setbacks, with both USD/JPY and the Mag group of US equities giving in to bearish pressure.
- Next week will likely tell us what this really is as we have four of the Mag 7 reporting earnings, along with the Wednesday FOMC rate decision.
- At this point USD/JPY has held support at the same 151.95 level that marked the high in 2022 and 2023, along with the May low after the BoJ’s first intervention in 2024. As USD/JPY has recovered, so have some of the equities that were beaten down over the past two weeks.
It’s been a busy couple of weeks in macro. It was the US CPI print from the Thursday before last that appears to have been somewhat of a turning point in sentiment. US CPI printed below expectations again and expectations increased for the Fed to cut rates a third time this year. This would mean three consecutive meetings with cuts to finish the year, following next Wednesday’s meeting. With a mere 6.7% probability of a cut next Wednesday, markets are looking for the Fed to open the door to that policy softening and then continue with 75 bps of moderation surrounding the US Presidential election.
But rate cut potential has been a large driver of the AI-theme which has been a big part of the equity rally that’s taken hold from last year’s lows; so there’s an ill fit between the headlines and the drivers.
One ‘bubbling’ fear is the unwind of the USD/JPY carry trade, which can drive consequence in other markets. And, given the timing of these moves, there appears to be a possible fit there.
It was minutes after that US CPI report that the Bank of Japan intervened, which pushed USD/JPY back-below the 160.00 handle. That was also a nasty day for the Nasdaq with NQ printing a bearish engulf, which led into continued selling for the next couple of weeks. The S&P 500 was a bit slower on that driver but the week after (last week) showed the build of a bearish engulfing candlestick.
From the below chart, we can see a degree of shared pain with the USD/JPY pair in red, leading the way lower; followed by Nasdaq 100 futures in orange and S&P 500 futures in blue.
USD/JPY Four-Hour Chart, with NQ and ES
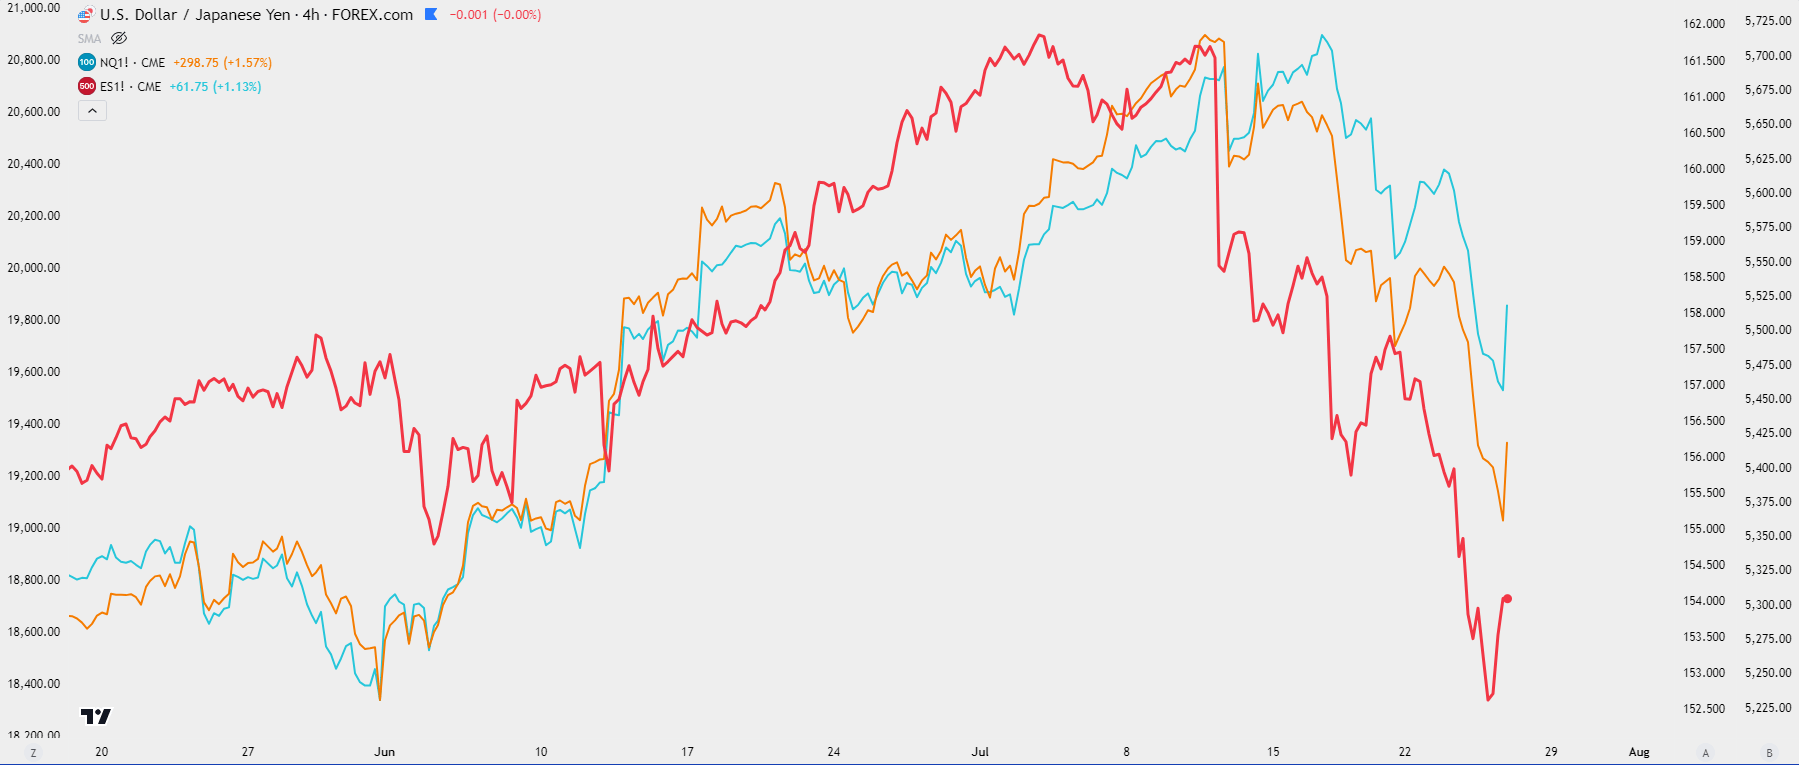 Chart prepared by James Stanley; data derived from Tradingview
Larger Fears of Carry Unwind Themes
While there’s appeared to be a shared relationship in the above themes thus far, there are some distinct drivers for each, and correlations often diverge at some point. With the drivers ahead, that is distinctly possible, so I want to parse through these themes individually to give each the respect that it deserves.
First and foremost, the Yen carry trade, which I wrote about yesterday when asking the question as to whether it was dying. As I noted in the article, it’s the 150-152 zone that carries a lot of weight and that’s just taken from the past couple of years.
Since then, the same level that held the highs in 2022 and 2023 has come into set the low, again, similar to what was seen in early-May. This plots at 151.95 and it’s already led to a strong bounce today.
USD/JPY Weekly Price Chart
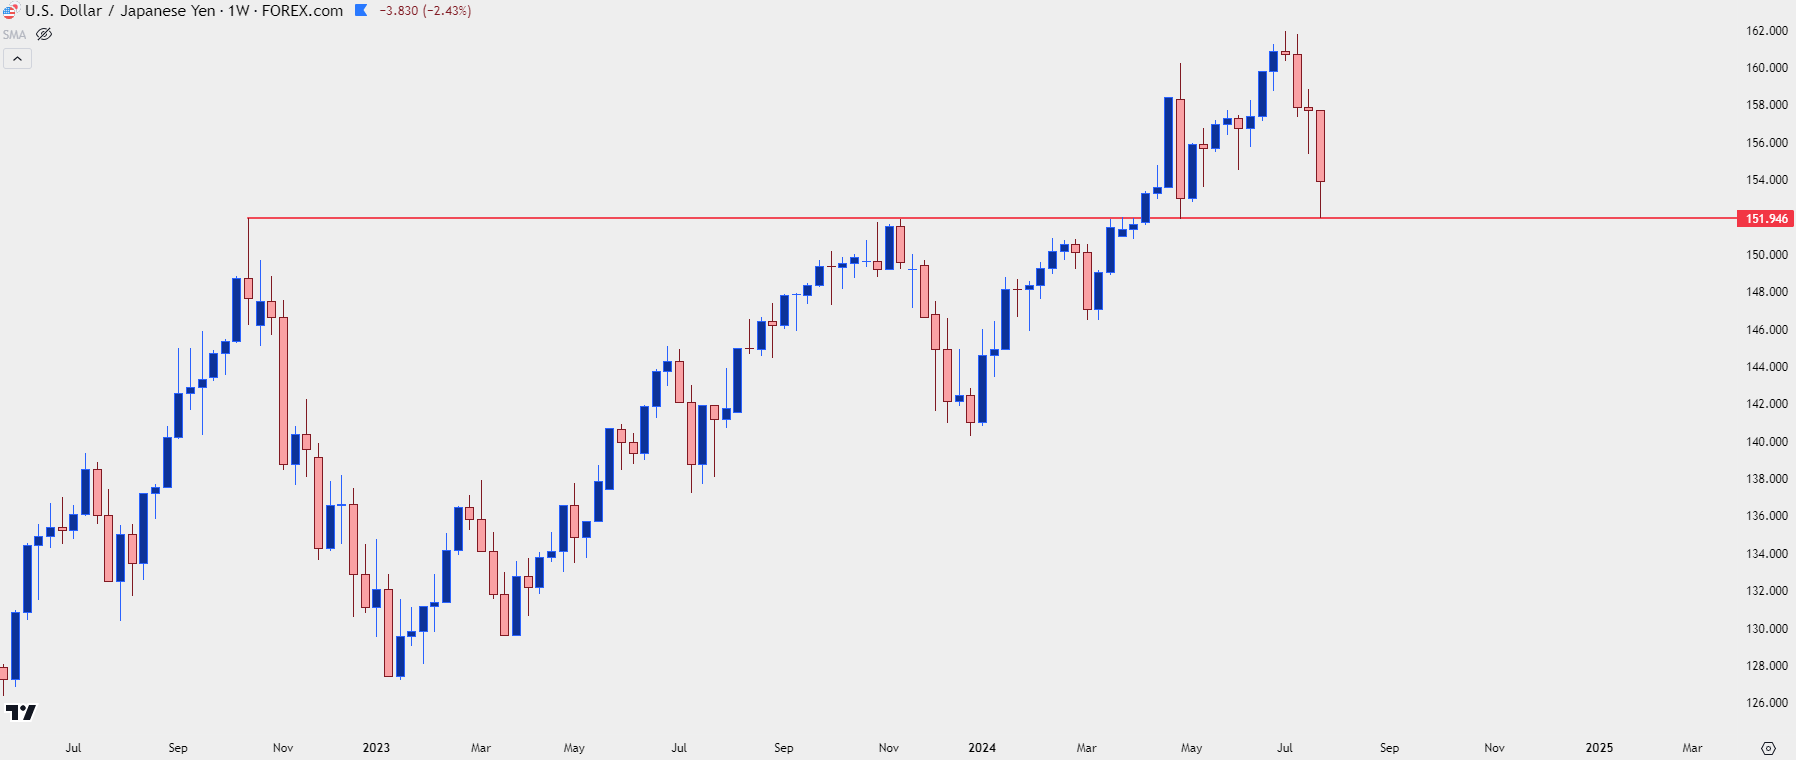 Chart prepared by James Stanley, USD/JPY on Tradingview
Can the USD/JPY Bounce Hold?
This is where the rubber meets the road, because if we are seeing legitimate unwind of the carry on the basis of rate cut hopes (or fears) from the Fed, then sellers are soon going to be on the spot.
I covered this in the video earlier this morning but we’ve already seen prices push up to re-test resistance at 154, and this continues a short-term pattern of higher-highs and lows. But it’s the 155 level that carries a bit more weight on a longer-term basis and if buyers can push up there, then that becomes a major decision point. If long-term bulls are feeling jumpy after the 1,000+ pip sell-off, a 155 level could elicit and attractive spot to take profits.
Given the peak low of 151.95 that was soon followed by a higher-low, which then extended into a higher-high, there’s scope for bulls to support the move if they can hold any pending pullbacks in the 153.00 area.
USD/JPY Two-Hour Price Chart
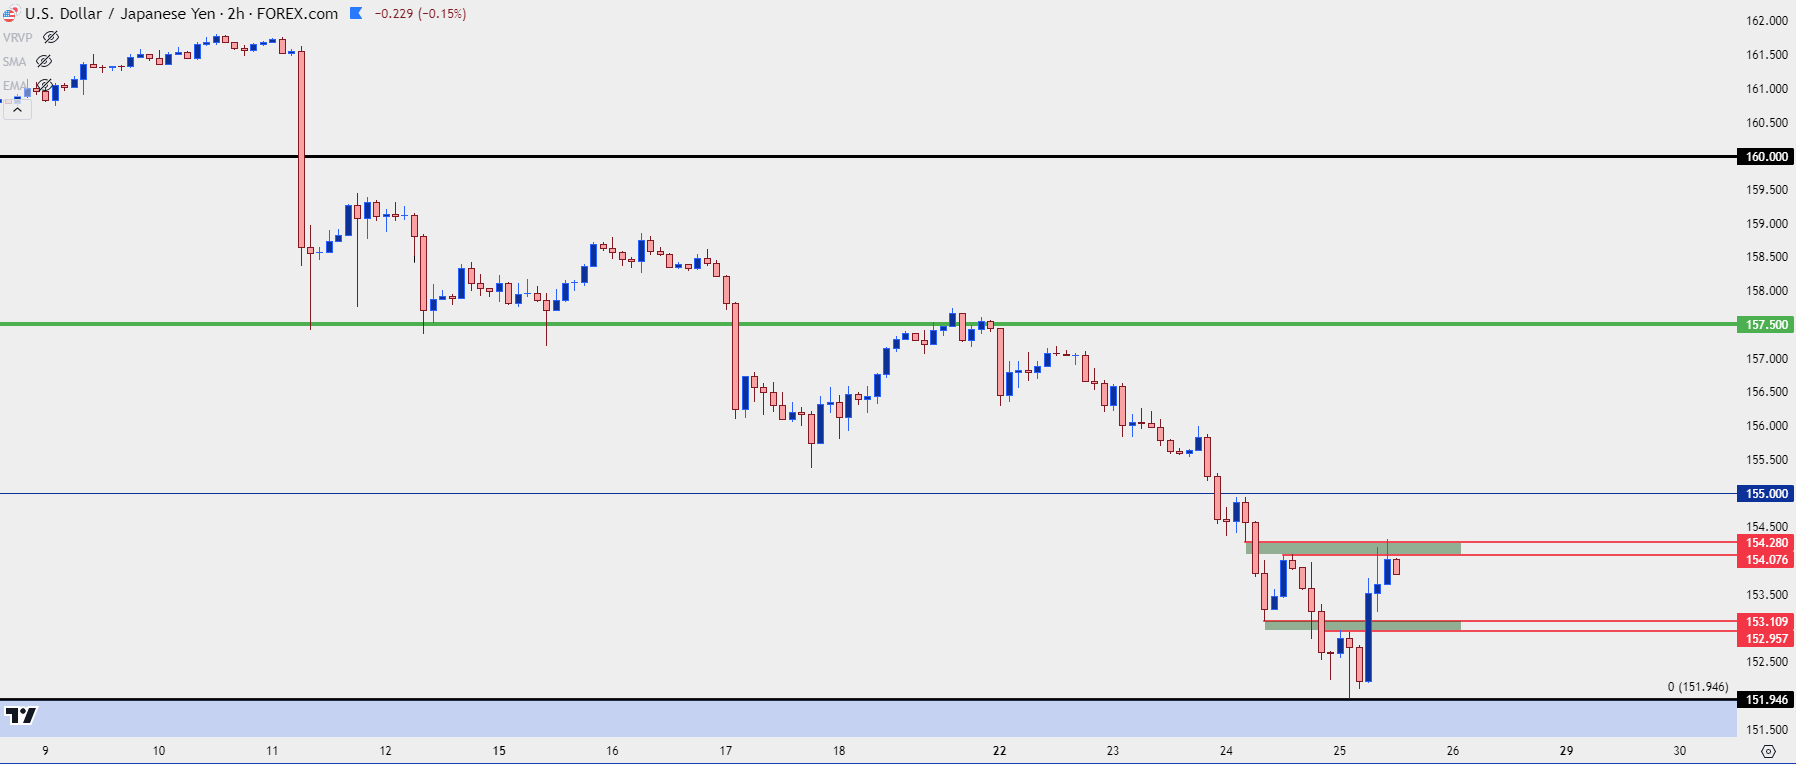 Chart prepared by James Stanley, USD/JPY on Tradingview
Where Does This Become a Larger Concern?
Taking a step back, it’s the 150-152 zone that remains incredibly important. And given the elongated trend, there’s likely some stops lodged below the 150 big figure that, if triggered, could lead to more supply and lower prices.
USD/JPY Weekly Price Chart
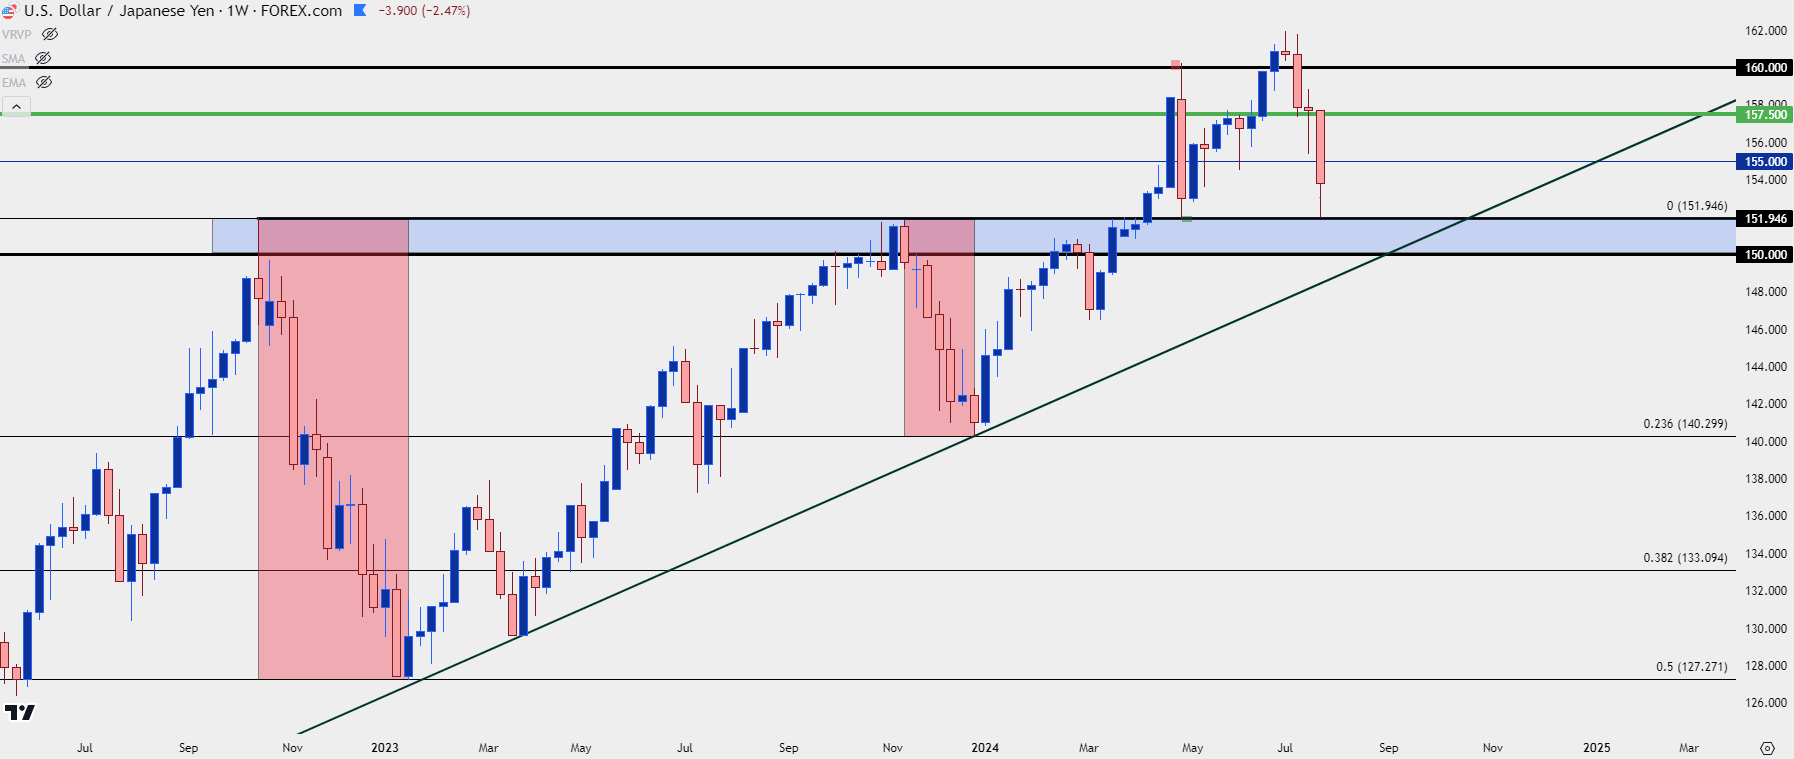 Chart prepared by James Stanley, USD/JPY on Tradingview
The AI Theme
Chat GPT was unveiled shortly after equities set a low in Q4 of 2022 and, at the time, there was a burgeoning hope for rate cuts from the Fed in the not-too-distant future.
Since then, we’ve had somewhat of a goldilocks backdrop, where the US economy has performed fairly well yet the Fed has continued to talk up rate cut potential, which has further energized the long side of stocks and that theme has remained fairly clear for much of the time since.
At the forefront of those rallies have been the Mag 7 group of stocks, with NVDA leading the way. NVDIA gained as much as 1,200% - yes, 1,200% from the Q4 2022 lows into the June highs.
NVDA Weekly: What 1,200% Looks Like
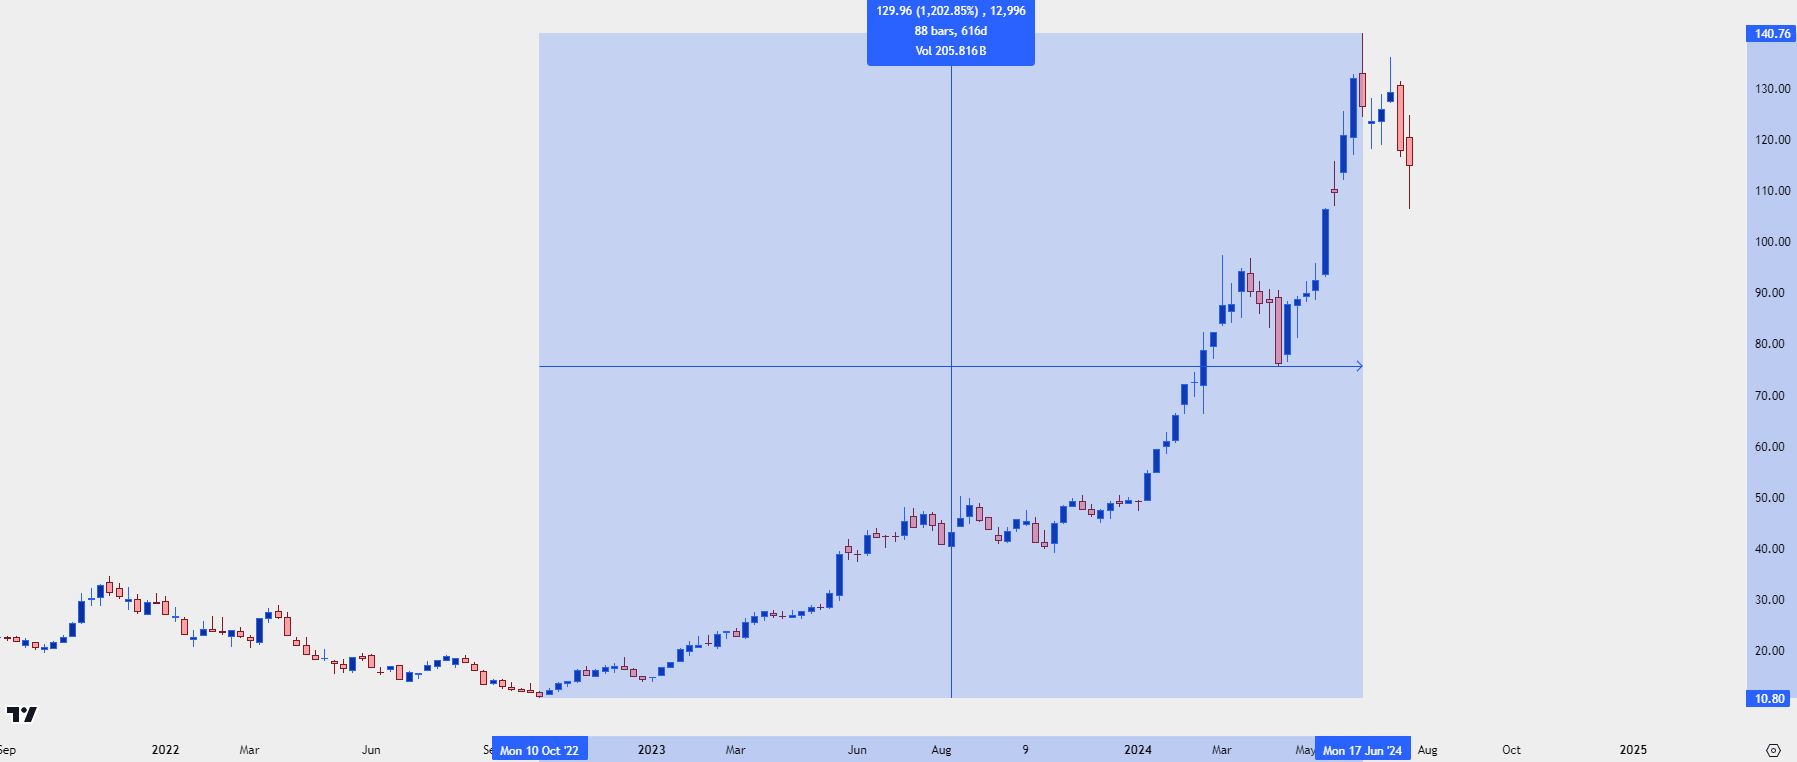 Chart prepared by James Stanley; data derived from Tradingview
A 1,200% move in any stock is a whopping amount but this is even more impressive when considering that NVDA was already rather large before this move showed up, which has amounted to literally Trillions of dollars in market cap.
And, to be sure, AI presents a lot of hope and potential but, like the World Wide Web in 1999 and 2000, there’s still a lack of revenue potential, and this has been getting more attention of late.
I’m personally of the mind that Artificial Intelligence before AGI is disinflationary, and AGI is going to take time and a lot of capital. There’s been a lot of assistance in the move from that goldilocks backdrop mentioned above and the prospect of rate cuts created a very narrow rally where much of the equity push of the past couple years has been concentrated in those seven mega-cap equities.
At their earnings call in April, Mark Zuckerberg was asked how META planned to draw revenue from all of the capital spend that they’ve devoted into AI and he didn’t seem to have a great answer, as his response sounded more like the Metaverse theme that fell flat in the year before. In response the stock dropped by -14.61% the next morning.
META Daily Chart: -14.61% Gap After Last Quarter’s Earnings Call
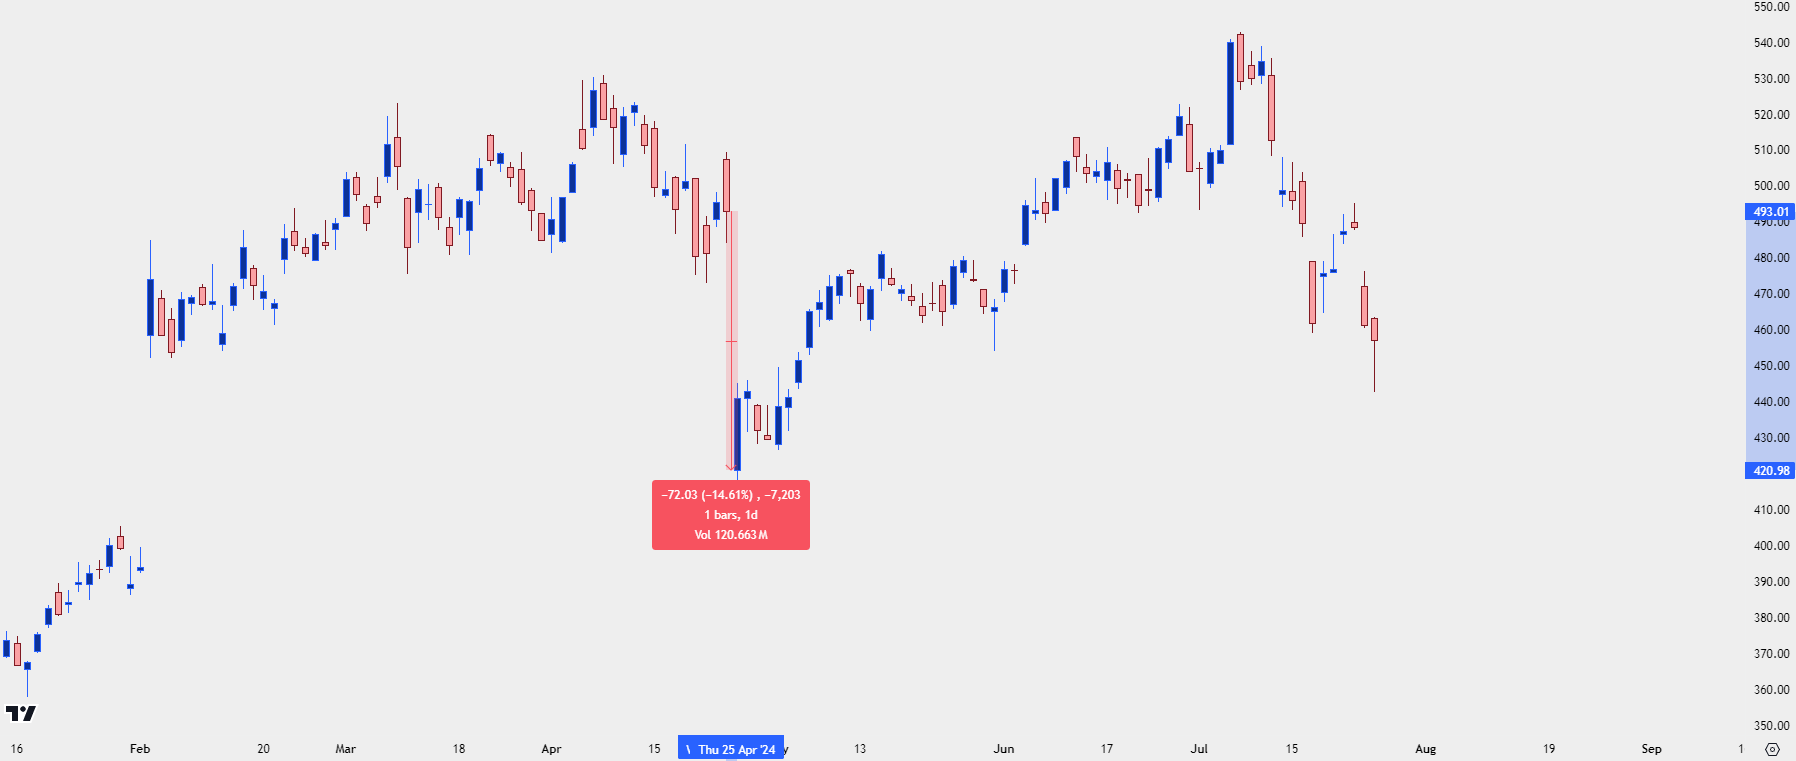 Chart prepared by James Stanley; data derived from Tradingview
The stock recovered in the days following as Satya Nadella with Microsoft seemed to be prepared for the same question when they reported earnings a day later; although he didn’t really have any concrete answers either. But – it was enough to help hold the lows, and as rate cut hopes returned after the May 1 FOMC rate decision, investors seemed to have already forgotten about the prior sell-off.
It was the NVDA earnings call that really seemed to super-charge matters as Jensen Huang brought out a few different surprises, including a stock split, and that helped to get the AI theme back up to fresh highs and as you can see from the above chart of Meta, a new ATH was established shortly after the July open.
And as NVDA has been the leader of the AI-theme on the way up, that earnings call seemed to heat up the backdrop for much of the Mag 7 group of stocks.
Interestingly, as we’ve seen this mean reversion show up in the past couple of weeks even the leader of the pack hasn’t been unscathed, as NVDA has posed a stark pullback from the June highs.
In the video linked atop this article, I had looked into the stock while pointing out a couple of key supports, and the 106.31 level that marked the bottom of a gap from just after that earnings call has, so far, set the low for today.
NVDA Four-Hour Price Chart
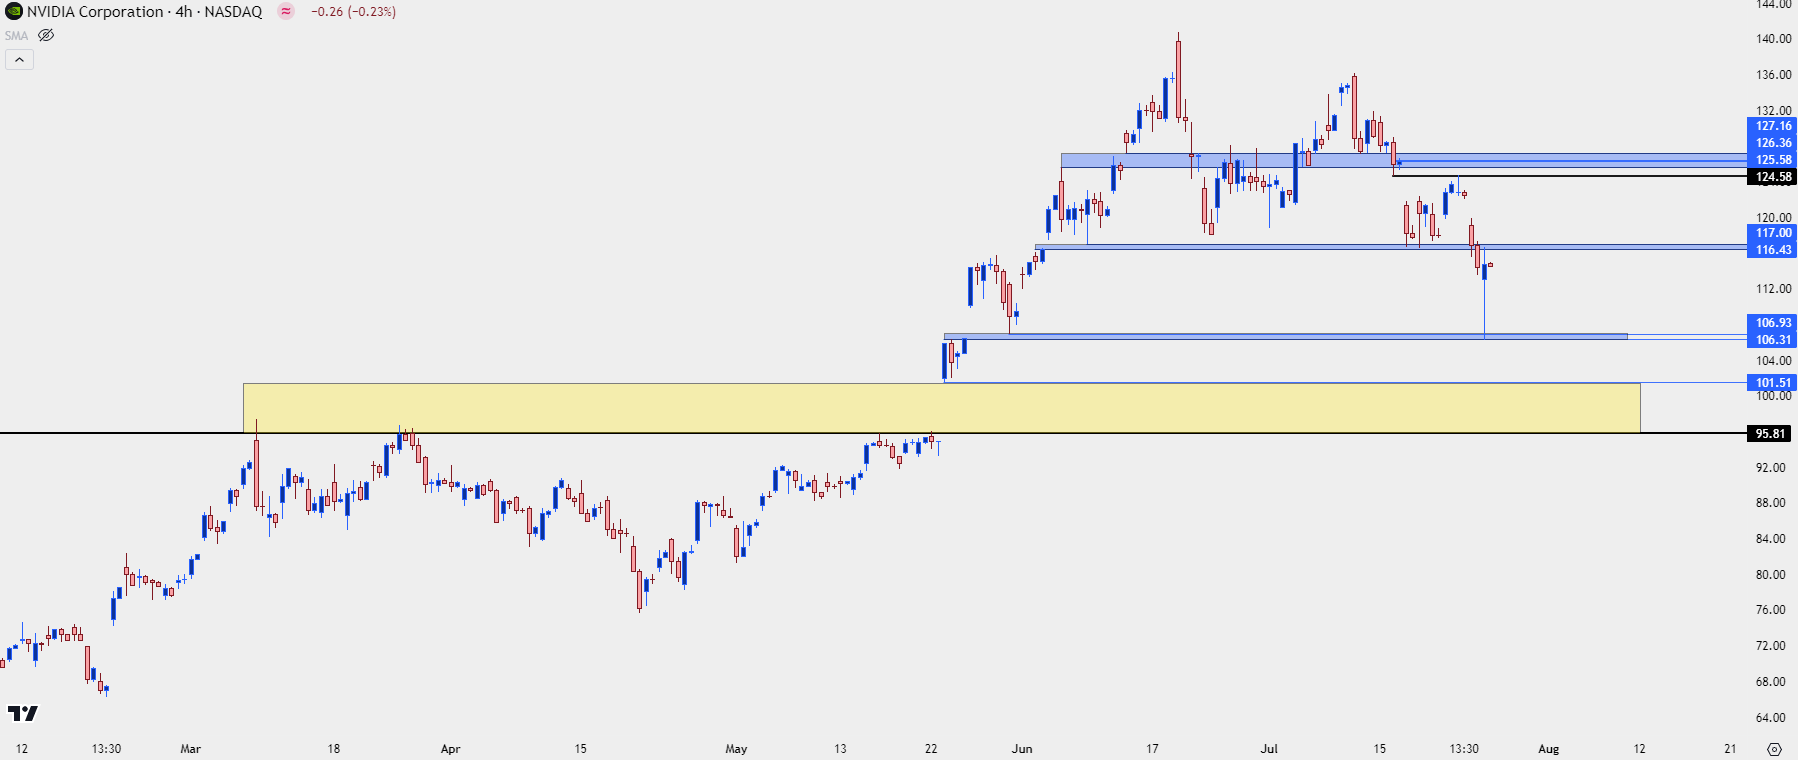 Chart prepared by James Stanley; data derived from Tradingview
Why the Worry Now?
There was a harsh sell-off yesterday and it seemed that much of FinTwit got bearish all of the sudden, but the sell-off in NQ showed after earnings calls from two of the tech leaders of Tesla and Google.
The Google call was of interest, as CEO Sundar Pichai was asked how the company planned to recover the CapEx spend behind their AI efforts and his response was unclear. He mentioned something along the lines of the larger risk being going too light on AI investment but, he still didn’t show any major revenue opportunity.
This feels very similar to last quarter after the Meta call, and as I noted above I’m of the mind that AI in current form is more of a disinflationary driver than a brute force source of growth. In the below chart of Google/Alphabet, we can see a similar albeit more restrained version of the Meta story above, where the stock gapped-down by -4.47% after that earnings call despite the numbers not being all that bad.
Google Daily Price Chart
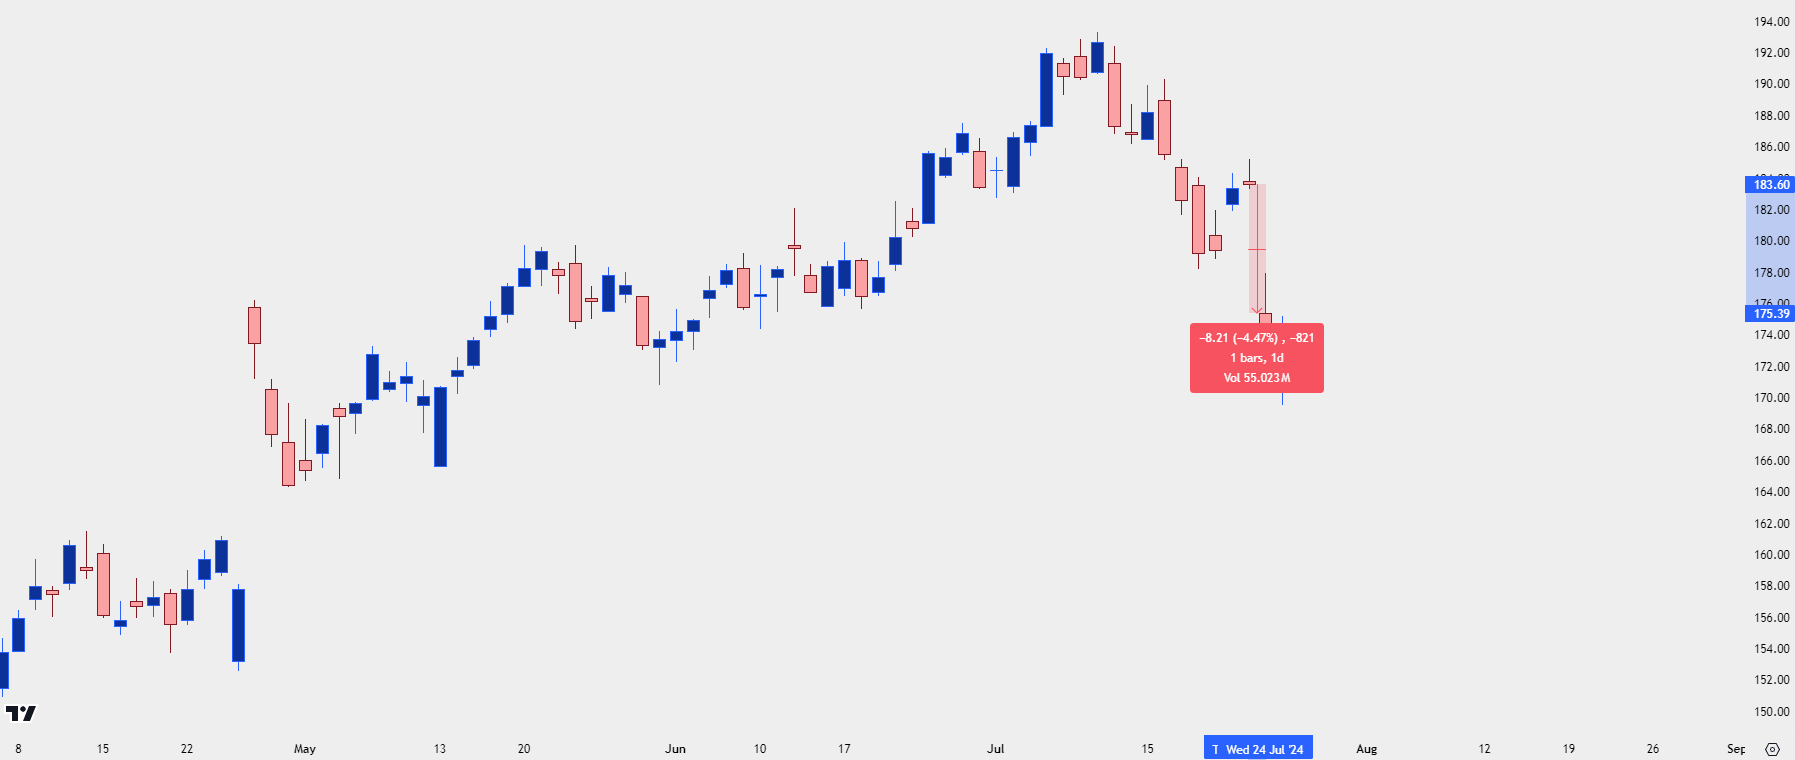 Chart prepared by James Stanley; data derived from Tradingview
Next Week Will Decide What This Is
As I shared in the video above, I do think that there’s an AI bubble in equity markets, but I do not think that it’s popping right now. Next week puts this in the spotlight as we’re going to have a busy three-day-period in the middle of the week.
On Tuesday, we hear from Microsoft and they helped to save the day for the AI theme back in April. I’m anticipating MSFT having some nice things to say about OpenAI and AI in general. The next day is an FOMC rate decision, and this is where markets are expecting the Fed to lay the groundwork for their first rate cut in September. There’s also an earnings release from Meta after the bell, so that’ll be a big day.
And then next Thursday brings earnings reports from Amazon and Apple, both Mag 7 constituents with heavy AI-exposure.
In the Nasdaq 100, we’ve seen a bounce from the 19k level so far this morning and that was the spot of support identified in the morning video. There’s resistance potential at 19,500 and 19,700 and if sellers remain aggressively bearish, these would be levels that could be ripe for defense with lower-high potential.
Nasdaq 100 Daily Price Chart
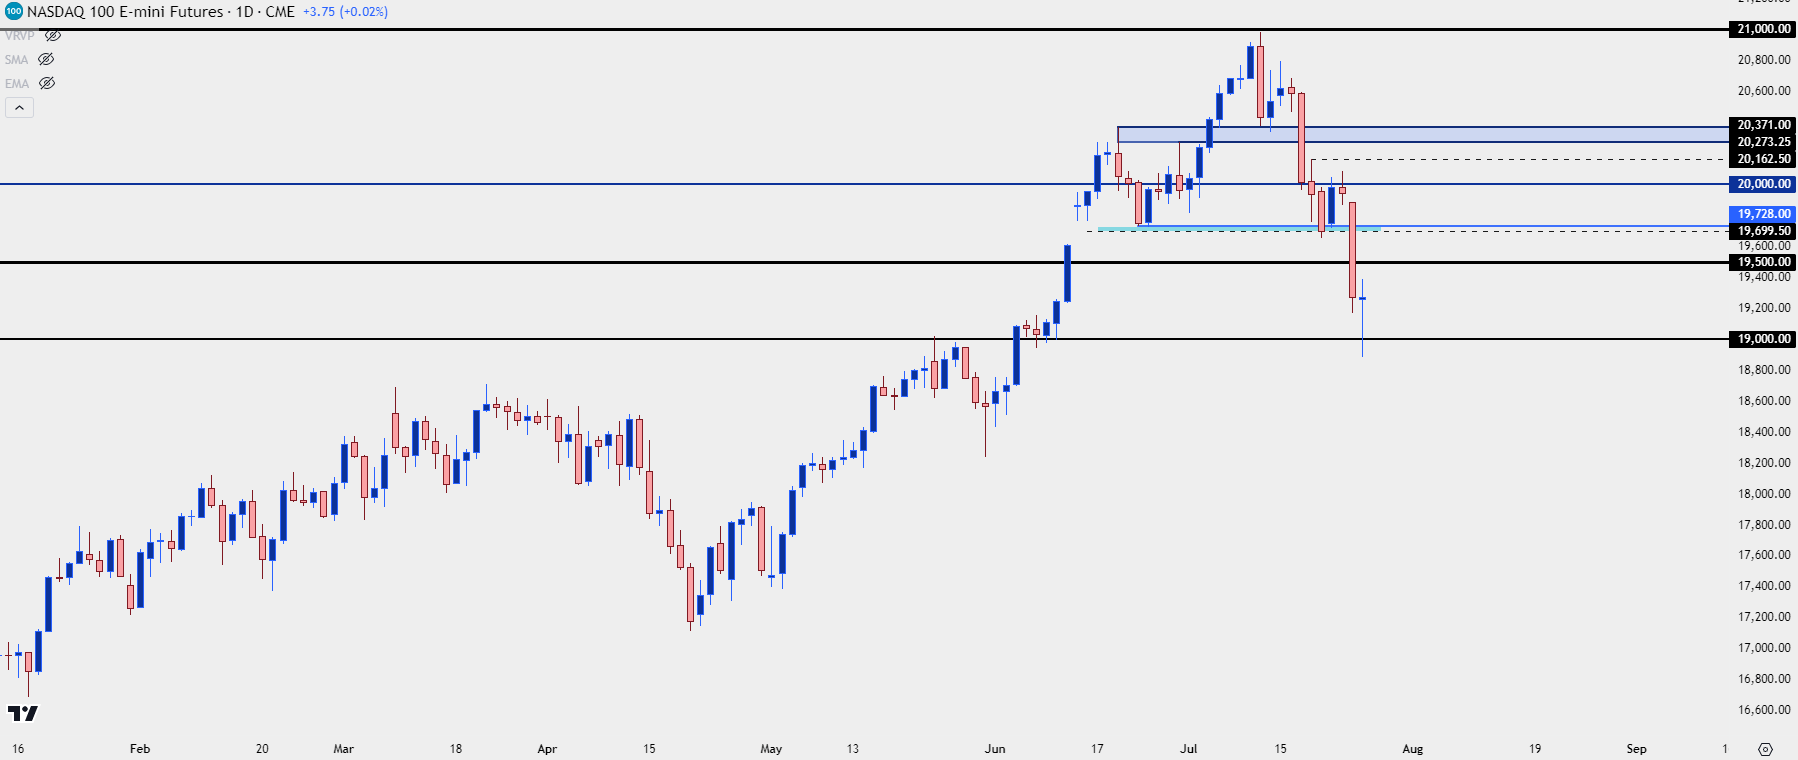 Chart prepared by James Stanley; data derived from Tradingview
ES 5500
In the S&P 500, we’re already seeing a re-test of resistance at prior support and tomorrow’s Core PCE data could have some sway here. Bulls weren’t able to get very far beyond the 5517 level earlier today but they were able to pierce the 5500 psychological level, setting up potential for a larger pullback. The next resistance level that I’m tracking there is the 5562-5588 zone of prior resistance-turned-support.
S&P 500 Futures Two-Hour Price Chart
 Chart prepared by James Stanley; data derived from Tradingview
--- written by James Stanley, Senior Strategist


