US Dollar Outlook: USD/JPY
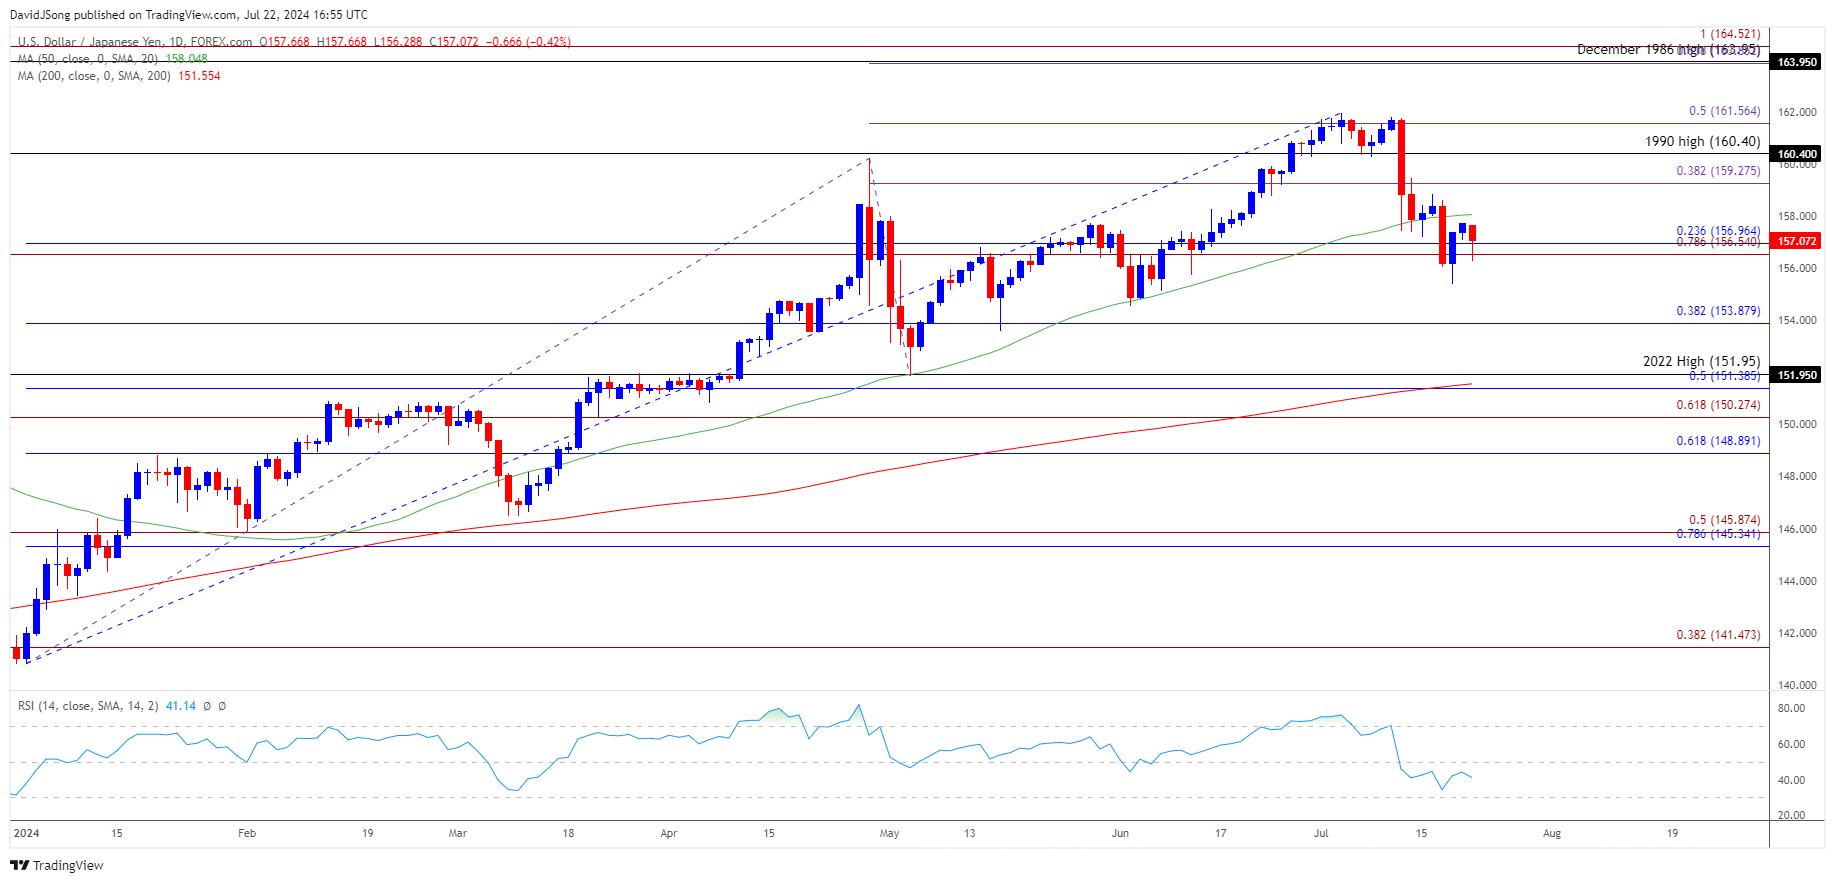
USD/JPY appears to be reversing ahead of the 50-Day SMA (158.05) as it gives back the rebound from the monthly low (155.38), and the exchange rate may struggle to retain the advance from the June low (154.54) as it no longer tracks the positive slope in the moving average.
USD/JPY Reverses Ahead of 50-Day SMA to Approach Monthly Low
Keep in mind, the recent selloff in USD/JPY emerged as it failed to hold within the opening range for July, and failure to trade back above the moving average may indicate a shift in carry trade interest amid growing speculation for a change in Federal Reserve policy.
Join David Song for the Weekly Fundamental Market Outlook webinar. David provides a market overview and takes questions in real-time. Register Here
It remains to be seen if the Federal Open Market Committee (FOMC) will further adjust its forward guidance as Governor Adriana Kugler acknowledges that ‘supply and demand are gradually coming into better balance,’ and the central bank may prepare US households and businesses for a less restrictive policy as the Personal Consumption Expenditure (PCE) Price Index is anticipated to show slowing inflation.
US Economic Calendar

The core PCE, the Fed’s preferred gauge for inflation, is seen narrow to 2.5% in June from 2.6% per annum the month prior, and evidence of easing price growth may produce headwinds for the US Dollar as encourages the Fed to implement a rate-cut in 2024.
At the same time, a higher-than-expected PCE print may force the FOMC to further combat inflation, and signs of persistent price growth may curb the recent weakness in USD/JPY as it raises the Fed’s scope to keep US interest rates higher for longer.
With that said, USD/JPY may stage further attempts to trade back above the 50-Day SMA (158.05) if it defends the monthly low (155.38), but the exchange rate may struggle to retain the advance from the June low (154.54) as it no longer tracks the positive slope in the 50-Day SMA (158.05).
USD/JPY Price Chart – Daily

Chart Prepared by David Song, Strategist; USD/JPY on TradingView
- USD/JPY holds below the 50-Day SMA (158.05) as it no longer carves a series of higher highs and lows, and failure to defend the monthly low (155.38) may lead to a test of the June low (154.54) as it no longer tracks the positive slope in the moving average.
- A break/close below 153.90 (38.2% Fibonacci retracement) opens up the May low (151.87), which largely lines up with the former-resistance zone around the 2022 high (151.95).
- At the same time, USD/JPY may face range bound conditions should it defend the monthly low (155.38), with a push above the moving average bringing the 159.30 (38.2% Fibonacci extension) to 159.80 (100% Fibonacci extension) region on the radar.
Additional Market Outlooks
Canadian Dollar Forecast: USD/CAD Eyes Monthly High Ahead of BoC
GBP/USD Forecast: RSI Falls Back from Overbought Zone
--- Written by David Song, Strategist
Follow on Twitter at @DavidJSong


