US Dollar Outlook: USD/JPY
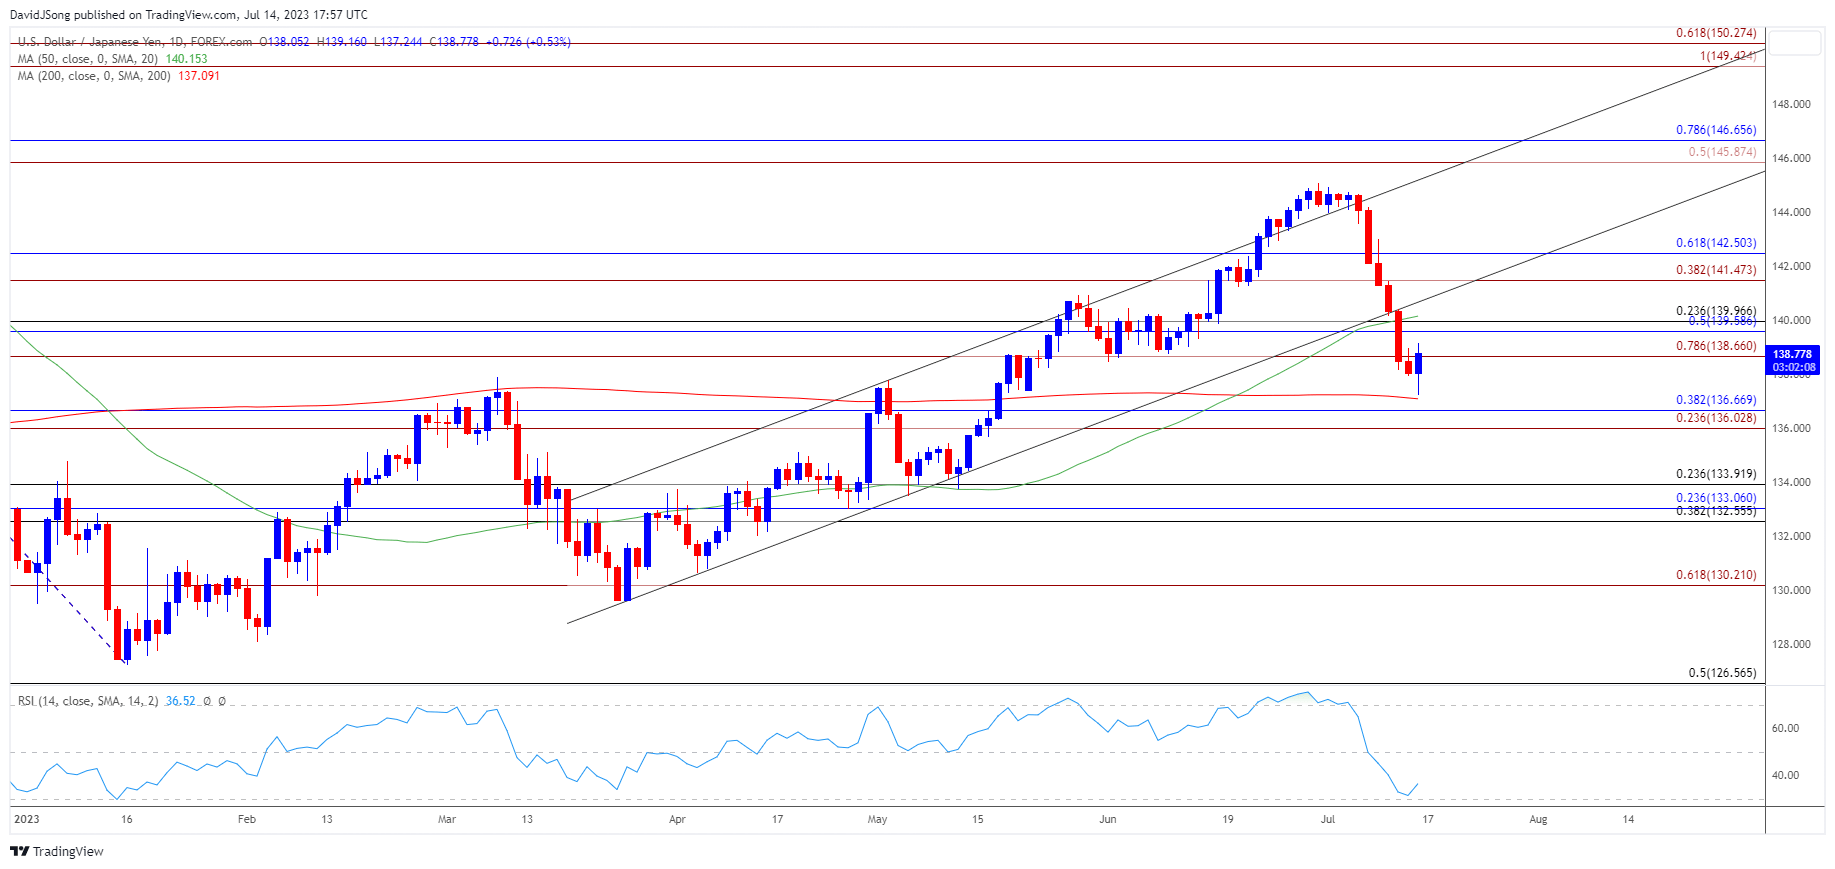
USD/JPY has taken out the June low (138.44) after failing to retain the upward trending channel from earlier this year, but the exchange rate appears to be reversing ahead of the 200-Day SMA (137.09) as it snaps the series of lower highs and lows carried over from last week.
USD/JPY Reverses Ahead of 200-Day SMA to Halt Six-Day Selloff
USD/JPY attempts to halt a six-day selloff as it bounces back from a fresh monthly low (137.24), with the rebound in the exchange rate keeping the Relative Strength Index (RSI) out of oversold territory.
The RSI may show the bearish momentum amid the failed attempt to push below 30, and data prints coming out of the US may prop up USD/JPY as the Retail Sales report is anticipated to show a pickup in household consumption.
Join David Song for the Weekly Fundamental Market Outlook webinar. David provides a market overview and takes questions in real-time. Register Here
US Economic Calendar

Retail spending is projected to increase 0.5% in June after expanding 0.3% the month prior, and little indications of a recession may push the Federal Reserve to further combat inflation as Governor Christopher Waller points out that ‘the Summary of Economic Projections (SEP) signaled two additional rate hikes by the end of this year.’
Recent remarks from Governor Waller, a permanent voting-member on the Federal Open Market Committee (FOMC), suggest the central bank will pursue a more restrictive policy as ‘job growth is still well above the pre-pandemic average,’ and it remains to be seen if the Fed will adjust the forward guidance at the next interest rate decision on July 26 as officials ‘need to keep policy restrictive for some time in order to have inflation settle down around our 2% target.’

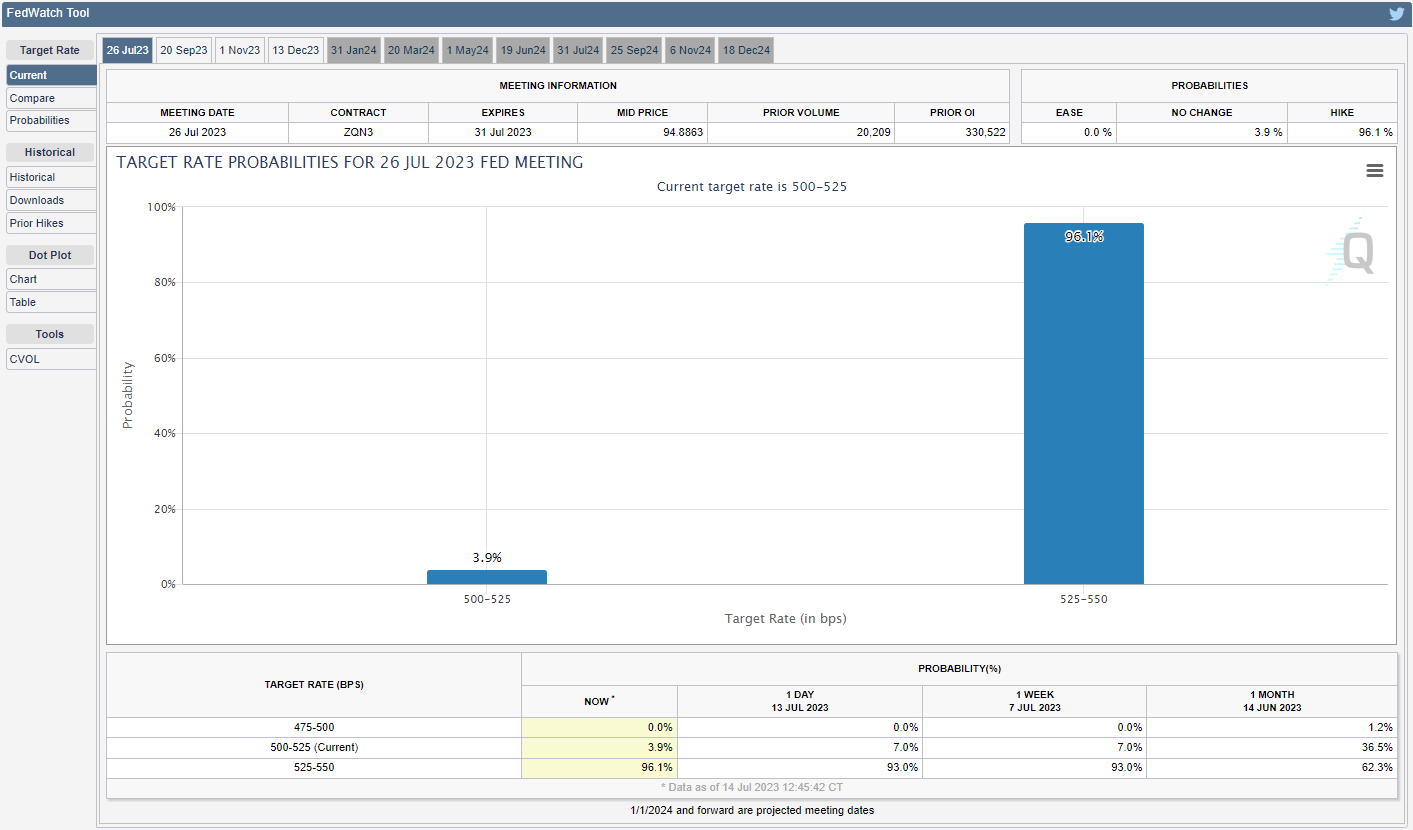
Source: CME
Until then, speculation surrounding Fed policy may sway USD/JPY as the CME FedWatch Tool reflects a greater than 90% chance for a 25bp rate hike later this month, and the exchange rate may attempt to reestablish the upward trend from earlier this year as the Bank of Japan (BoJ) seems to be in no rush to move away from Qualitative and Quantitative Easing (QQE) with Yield-Curve Control (YCC).
With that said, USD/JPY may stage a larger rebound as it appears to be reversing ahead of the 200-Day SMA (137.09), and the Relative Strength Index (RSI) may show the bearish momentum amid the failed attempt to push into oversold territory.
Japanese Yen Price Chart – USD/JPY Daily

Chart Prepared by David Song, Strategist; USD/JPY on TradingView
- USD/JPY snaps the series of lower highs and lows carried over from last week as it struggles to test the 200-Day SMA (137.09), with the Relative Strength Index (RSI) highlighting a similar dynamic amid the failed attempt to push below 30.
- The RSI may show the bearish momentum abating as it bounces back ahead of oversold territory, with a move above the 138.70 (78.6% Fibonacci extension) to 140.00 (23.6% Fibonacci retracement) area bringing the 141.50 (38.2% Fibonacci extension) to 142.50 (61.8% Fibonacci retracement) zone back on the radar.
- However, failure to hold above the moving average may push USD/JPY towards the 136.00 (23.6% Fibonacci extension) to 136.70 (38.2% Fibonacci retracement) area, with the next area of interest coming in around 133.90 (23.6% Fibonacci retracement).
Additional Market Outlooks:
British Pound Forecast: GBP/USD Bull Flag Formation Unfolds
USD/CAD Reveres Ahead of 50-Day SMA to Snap July Opening Range
--- Written by David Song, Strategist
Follow on Twitter at @DavidJSong


