USD/JPY Outlook
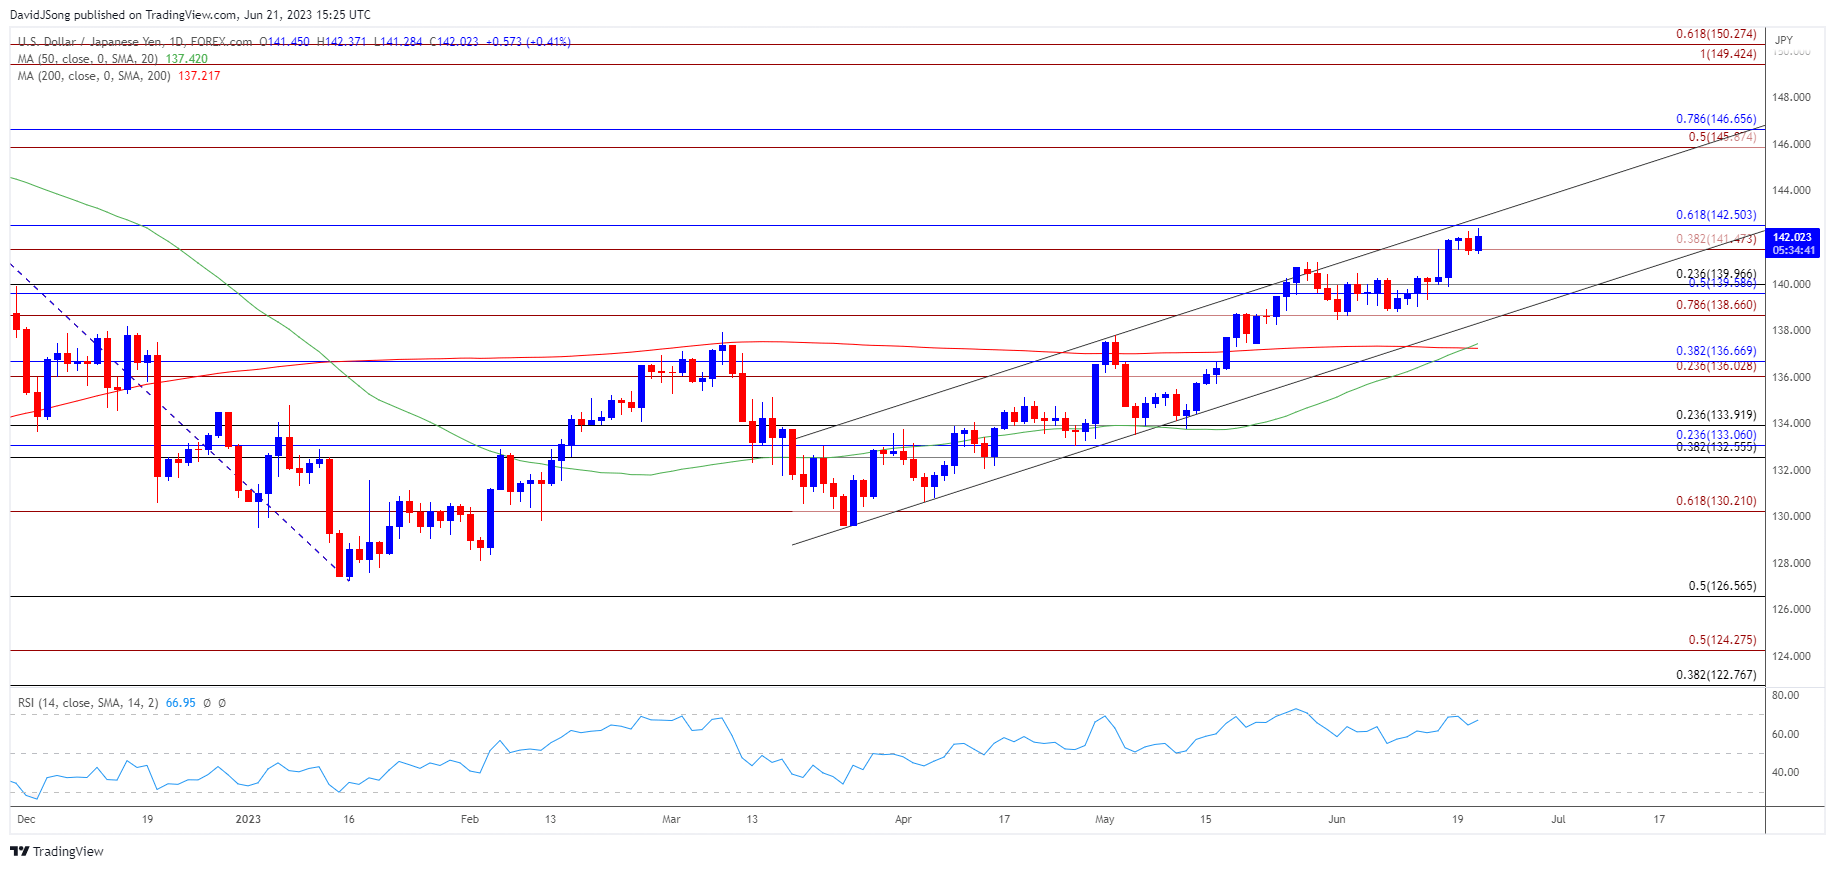
USD/JPY continues to register a fresh yearly high (142.37) in June as the Bank of Japan (BoJ) plans to ‘patiently continue with monetary easing,’ but the Relative Strength Index (RSI) appears to be diverging with price as the oscillator struggles to push into overbought territory.
USD/JPY Rate Outlook Vulnerable to RSI Divergence
USD/JPY trades around the upper bounds of the ascending channel as Federal Reserve Chairman Jerome Powell prepares US lawmakers for higher interest rates, and speculation for a more restrictive policy may keep the exchange rate afloat as ‘nearly all FOMC participants expect that it will be appropriate to raise interest rates somewhat further by the end of the year.’
Join David Song for the Weekly Fundamental Market Outlook webinar. Register Here
The prepared remarks from Chairman Powell suggest the Federal Open Market Committee (FOMC) will reestablish its hiking-cycle as ‘the process of getting inflation back down to 2 percent has a long way to go,’ and it seems as though the central bank will take further steps to combat inflation as ‘restoring price stability is essential to set the stage for achieving maximum employment and stable prices over the longer run.’

Source: CME
In turn, the CME FedWatch Tool may continue reflect growing expectations for higher US interest rates as market participants now price a greater than 70% probability for a 25bp rate hike in July, and it remains to be seen if Chairman Powell and Co. will continue to project a steeper trajectory for the Fed Funds rate as inflation remains above the central bank’s 2% target.
With that said, the diverging paths for monetary policy may keep USD/JPY within the upward trending channel from earlier this year as the BoJ remains reluctant to change gears, but the Relative Strength Index (RSI) appears to be diverging with price as the oscillator struggles to push into overbought territory.
Japanese Yen Price Chart – USD/JPY Daily

Chart Prepared by David Song, Strategist; USD/JPY on TradingView
- USD/JPY approaches channel resistance as it trades to a fresh yearly high (142.37), but lack of momentum to break/close above the 141.50 (38.2% Fibonacci extension) to 142.50 (61.8% Fibonacci retracement) area may lead to a pullback in the exchange rate as the Relative Strength Index (RSI) appears to be diverging with price.
- The RSI may show the bullish momentum abating as it struggles to push above 70, with a move below the 138.70 (78.6% Fibonacci extension) to 140.00 (23.6% Fibonacci retracement) region raising the scope for a test of channel support.
- Failure to retain the upward trending channel may push USD/JPY towards the 50-Day SMA (137.24), but the exchange rate may track the positive slope in the moving average as long as it holds above the monthly low (138.44).
- Need a break/close above the 141.50 (38.2% Fibonacci extension) to 142.50 (61.8% Fibonacci retracement) area to open up the 145.90 (50% Fibonacci extension) to 146.70 (78.6% Fibonacci retracement) region, with the next region of interest coming in around the November 2022 high (148.83).
Additional Market Outlooks:
GBP/USD Pulls Back to Keep RSI Out of Overbought Territory
EUR/USD Post-ECB Rally Puts April High in Sight
--- Written by David Song, Strategist
Follow on Twitter at @DavidJSong


