US Dollar Outlook: USD/JPY
USD/JPY trades back above the 50-Day SMA (140.63) as it extends the series of higher highs and lows from earlier this week, and the exchange rate may track the positive slope in the moving average as the Federal Reserve is expected to implement higher interest rates.
USD/JPY Rally Emerges – Outlook Hinges on Fed and BoJ Rate Decisions
USD/JPY appears to have reversed ahead of the 200-Day SMA (136.92) as it extends the advance from the monthly low (137.24), and the exchange rate may continue to retrace the decline from the yearly high (145.07) amid the diverging paths between the Fed and Bank of Japan (BoJ).
Join David Song for the Weekly Fundamental Market Outlook webinar. David provides a market overview and takes questions in real-time. Register Here

Source: CME
According to the CME FedWatch Tool, market participants a pricing a greater than 90% probability for a 25bp rate-hike, and the development may lead to a bullish reaction in USD/JPY should the Federal Open Market Committee (FOMC) keep the door open to pursue a more restrictive policy.
However, a shift in the forward guidance for monetary policy may produce headwinds for the Greenback as the Fed appears to be nearing the end of its hiking-cycle, and USD/JPY may struggle to retain the recent series of higher highs and lows amid speculation for lower US interest rates in 2024.
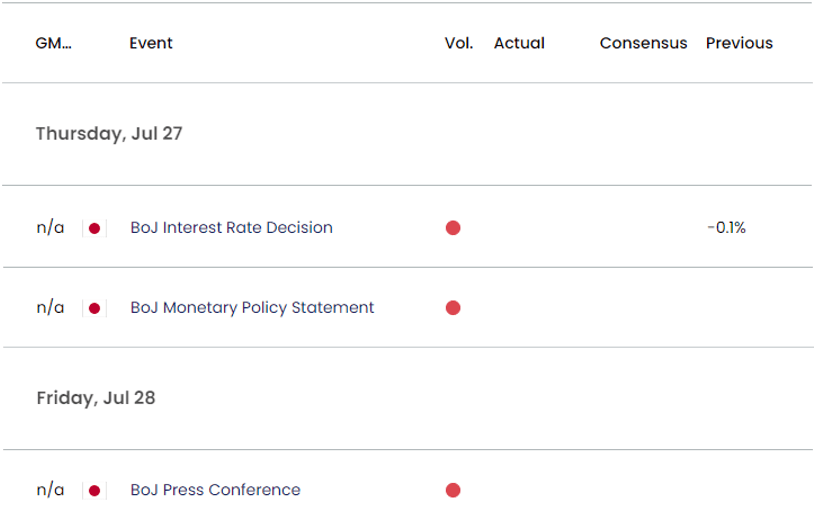
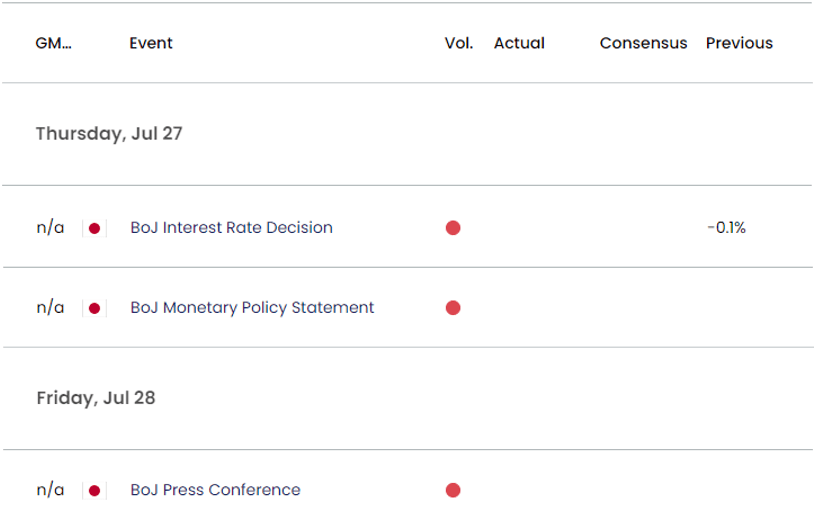
Japan Economic Calendar

Nevertheless, the BoJ rate decision keep USD/JPY afloat as the central bank seems to be in no rush to switch gears, and it seems as though the Policy Board will stick to Quantitative and Qualitative Easing (QQE) with Yield-Curve Control (YCC) as Governor Kazuo Ueda insists that ‘if our assumption is unchanged, our overall narrative on monetary policy remains unchanged’ while speaking at the G20 meeting in India.
With that said, more the same from the BoJ may keep the Japanese Yen under pressure, and USD/JPY may track the positive slope in the 50-Day SMA (140.63) if the Fed shows a greater willingness to combat inflation.
Japanese Yen Price Chart – USD/JPY Daily

Chart Prepared by David Song, Strategist; USD/JPY on TradingView
- USD/JPY appears to have reversed ahead of the 200-Day SMA (136.92) as it extends the advance from the monthly low (137.24), with the Relative Strength Index (RSI) reflecting a similar dynamic as it bounces back ahead of oversold territory.
- The four-day rally has pushed USD/JPY back above the 50-Day SMA (140.63), and the exchange rate may track the positive slope in the moving average as it retraces the decline from the monthly high (144.92).
- A break/close above the 141.50 (38.2% Fibonacci extension) to 142.50 (61.8% Fibonacci retracement) zone raises the scope for another run at the June high (145.07), with the next area of interest coming in around 145.90 (50% Fibonacci extension) to 146.70 (78.6% Fibonacci retracement).
- However, failure to retain the bullish price series may push USD/JPY back towards the 138.70 (78.6% Fibonacci extension) to 140.00 (23.6% Fibonacci retracement) area, with a move below the monthly low (137.24) opening up the 136.00 (23.6% Fibonacci extension) to 136.70 (38.2% Fibonacci retracement) region.
Additional Market Outlooks:
GBP/USD Outlook: Post-UK CPI Weakness Spurs Test of Former Resistance
Euro Forecast: EUR/USD Pullback Triggers RSI Sell Signal
--- Written by David Song, Strategist
Follow on Twitter at @DavidJSong


