US Dollar Outlook: USD/JPY
USD/JPY snaps the series of higher highs and lows carried over from last week as it weakens for the second straight day, and the exchange rate may face a larger pullback as the Relative Strength Index (RSI) reverses just ahead of overbought territory.
USD/JPY Breaks Above Monthly Opening Range to Eye Yearly High
USD/JPY continues to pullback from a fresh monthly high (146.56) to keep the RSI below 70, but the exchange rate may attempt to track the positive slope in the 50-Day SMA (142.32) as long as it holds above the moving average.
Join David Song for the Weekly Fundamental Market Outlook webinar. David provides a market overview and takes questions in real-time. Register Here
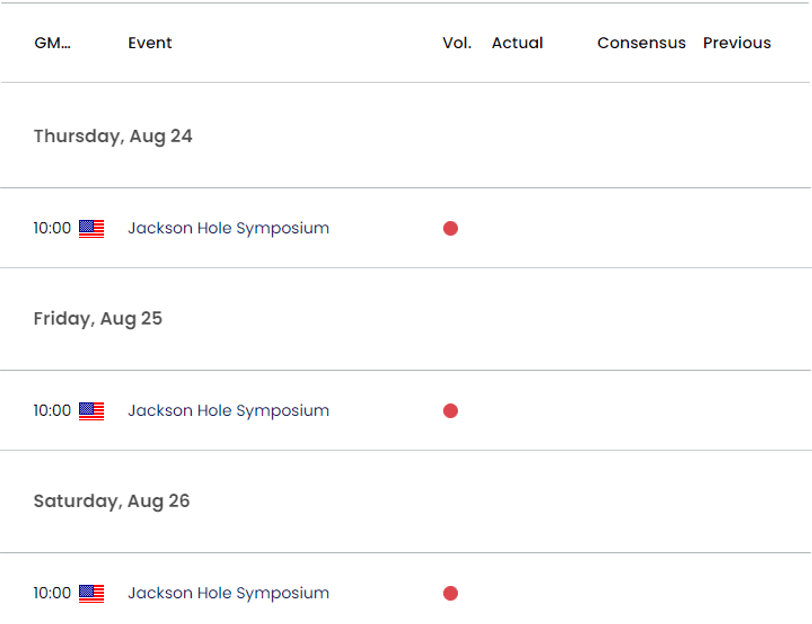
US Economic Calendar

Looking ahead, developments coming out of the Kansas City Fed Economic Symposium in Jackson Hole, Wyoming may sway USD/JPY as the Federal Reserve keeps the door open to implement higher interest rates, and little signs of a looming recession may push the central bank to pursue a more restrictive policy in an effort to further combat inflation.

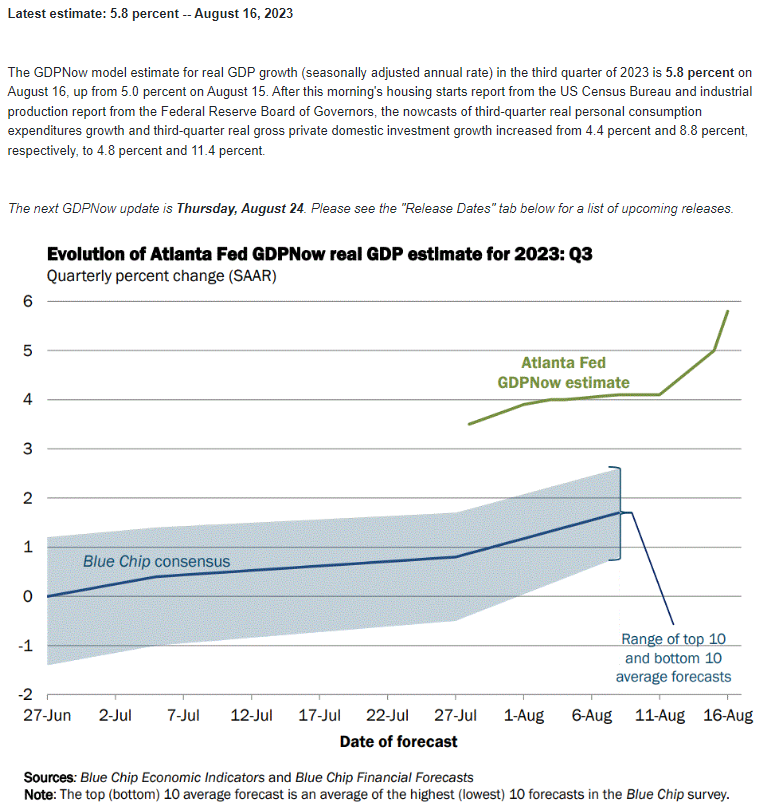
Source: Atlanta Fed
According to the Atlanta Fed GDP Now model, the ‘estimate for real GDP growth (seasonally adjusted annual rate) in the third quarter of 2023 is 5.8 percent on August 16, up from 5.0 percent on August 15,’ and it remains to be seen if the Federal Open Market Committee (FOMC) will adjust the forward guidance at the September meeting as the central bank is slated to update the Summary of Economic Projections (SEP).
Until then, the diverging paths between the FOMC and Bank of Japan (BoJ) may keep USD/JPY afloat as Governor Kazuo Ueda and Co. stick to Quantitative and Qualitative Easing (QQE) with Yield-Curve Control (YCC), and the exchange rate may attempt to track the positive slope in the 50-Day SMA (142.32) to mirror the price action from earlier this year.
With that said, the Fed symposium may influence the near-term outlook for USD/JPY as the FOMC continues to combat inflation, but the exchange rate may face a larger pullback over the coming days as it snaps the series of higher highs and lows carried over from last week.
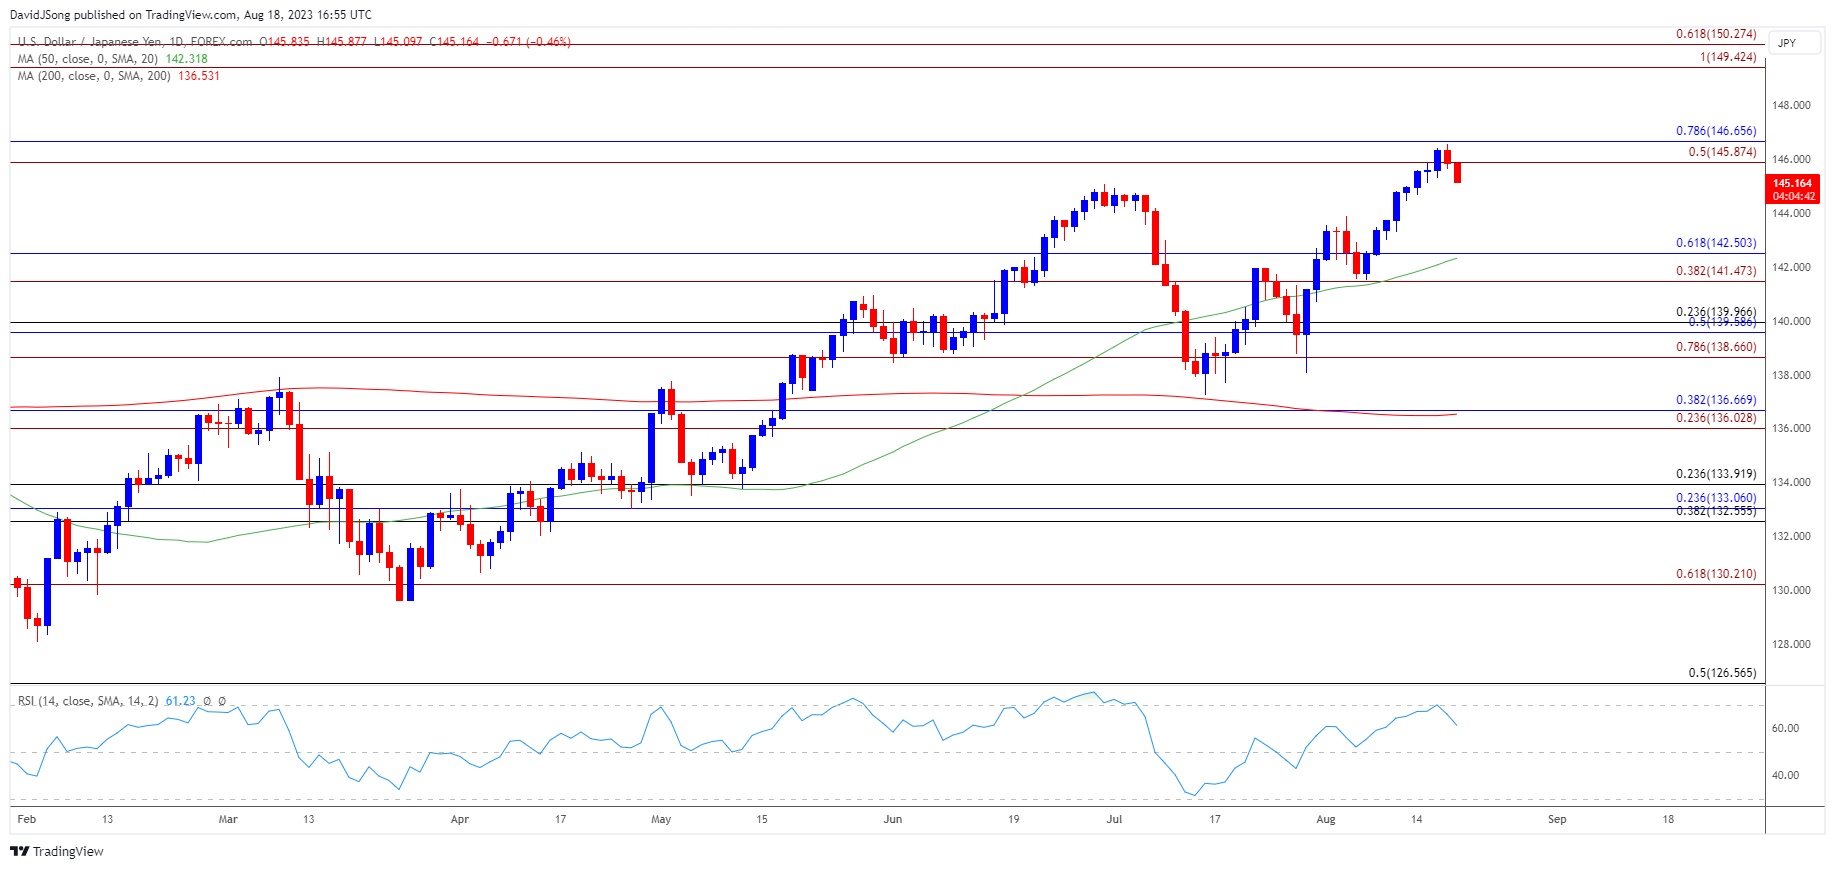
USD/JPY Price Chart – Daily

Chart Prepared by David Song, Strategist; USD/JPY on TradingView
- USD/JPY snaps the series of higher highs and lows carried over from last week as it pulls back from a fresh yearly high (146.56), with the failed attempt to break/close above the 145.90 (50% Fibonacci extension) to 146.70 (78.6% Fibonacci retracement) region keeping the Relative Strength Index (RSI) out of overbought territory.
- The bullish momentum may continue to abate as the RSI reveres ahead of 70, and USD/JPY may continue to give back the advance from the monthly low (141.52), with a break/close below the 141.50 (38.2% Fibonacci extension) to 142.50 (61.8% Fibonacci retracement) zone bringing the 138.70 (78.6% Fibonacci extension) to 140.00 (23.6% Fibonacci retracement) region back on the radar.
- Nevertheless, USD/JPY may track the positive slope in the moving average to mirror the price action from earlier this year, with a break/close above the 145.90 (50% Fibonacci extension) to 146.70 (78.6% Fibonacci retracement) region opening up the November 2022 high (148.83).
Additional Market Outlooks:
US Dollar Forecast: EUR/USD on Cusp of Testing July Low
Australian Dollar Forecast: AUD/USD at Risk of Oversold RSI Signal
--- Written by David Song, Strategist
Follow on Twitter at @DavidJSong


