US Dollar Outlook: USD/JPY
USD/JPY pulls back from a fresh monthly high (150.89) to keep the Relative Strength Index (RSI) out of overbought territory, but the exchange rate may attempt to test the 2023 high (151.91) as it breaks out of a bull-flag formation.
USD/JPY Post-US CPI Breakout Fails to Push RSI into Overbought Zone
USD/JPY appears to be tracking the recent weakness in long-term US Treasury yields as it gives back the advance following the higher-than-expected US Consumer Price Index (CPI), and looming developments in the RSI may show the bullish momentum abating amid the failed attempts to push above 70.
Join David Song for the Weekly Fundamental Market Outlook webinar. David provides a market overview and takes questions in real-time. Register Here
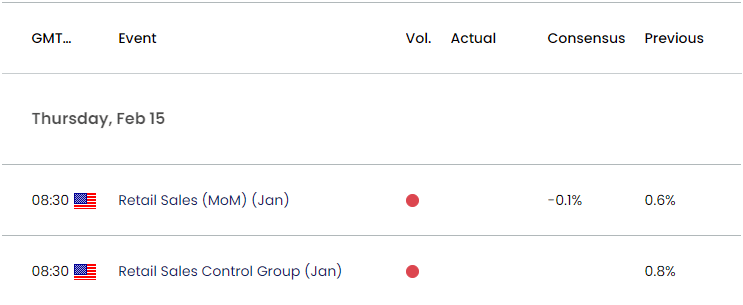
US Economic Calendar

At the same time, the update to the US Retail Sales report may drag on USD/JPY as household spending is projected to contract 0.1% in January, and signs of a slowing economy may push the Federal Reserve to further adjust its forward guidance for monetary policy as the Fed’s Summary of Economic Projections (SEP) reflect lower US interest rates in 2024.
However, an unexpected rise in US Retail Sales may spark a bullish reaction in the Greenback as Chairman Jerome Powell rules out a rate cut in March, and the diverging paths between the Bank of Japan (BoJ) and Federal Open Market Committee (FOMC may keep USD/JPY afloat as Governor Kazuo Ueda and Co. pledge to ‘patiently continue with monetary easing.’
With that said, USD/JPY may further retrace the decline from the 2023 high (151.91) ahead of the FOMC rate decision on March 20 as it breaks out of a bull-flag formation, but the Relative Strength Index (RSI) may show the bullish momentum abating as it struggles to push into overbought territory.
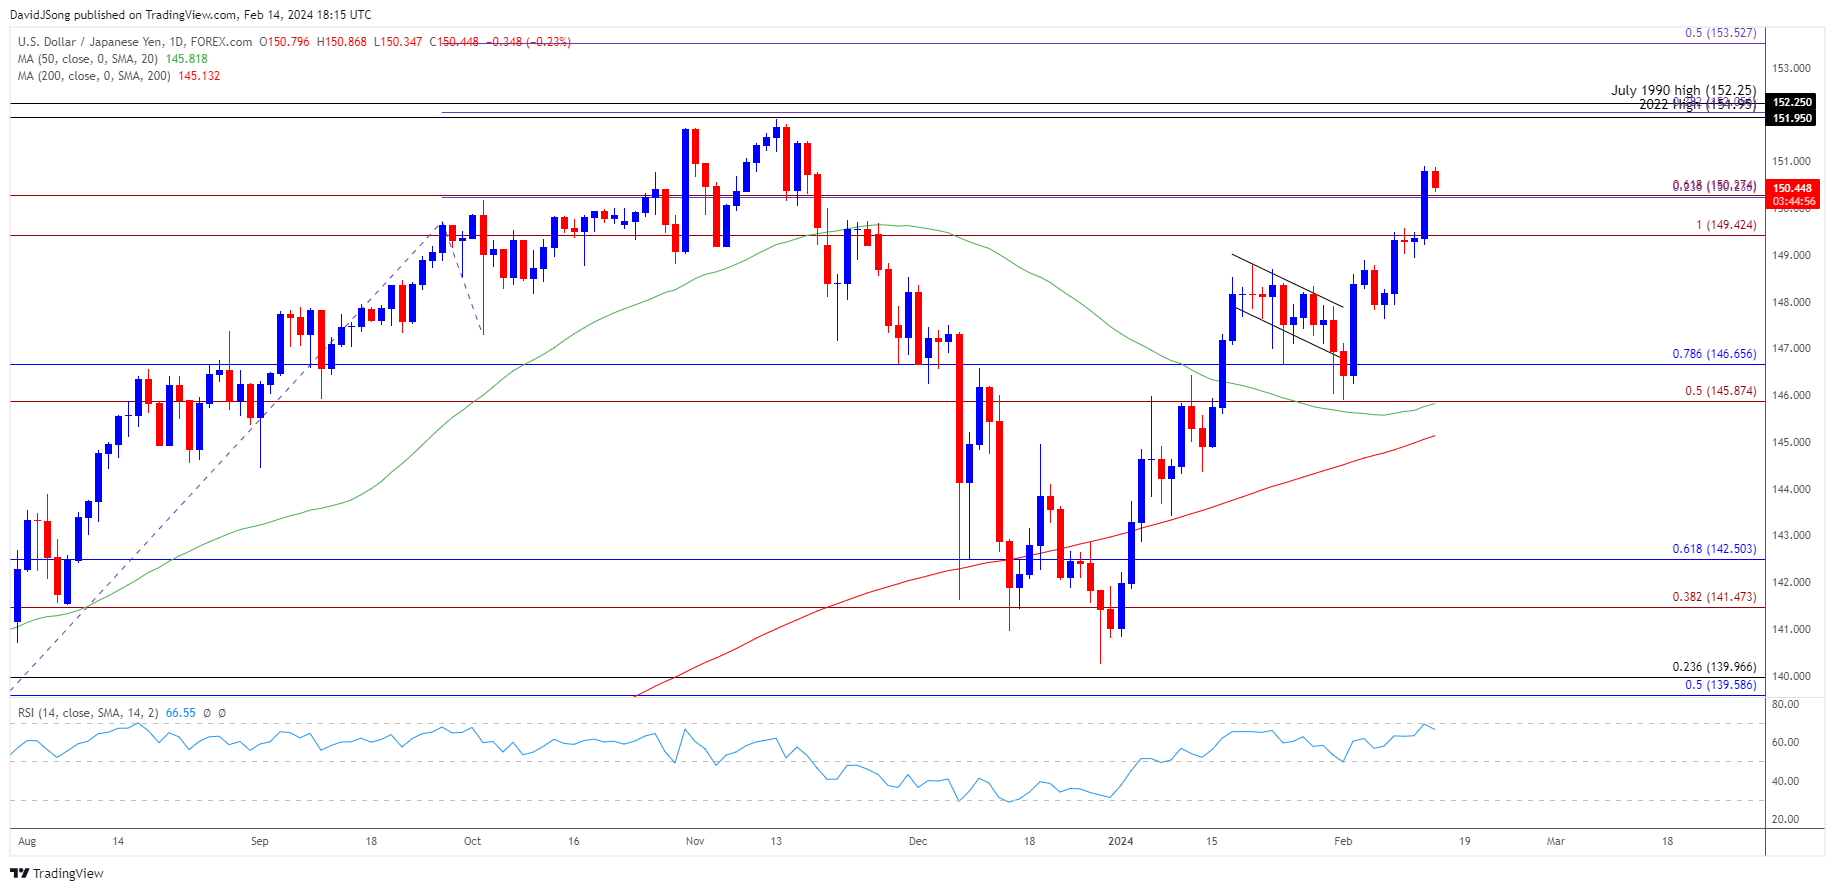
USD/JPY Price Chart – Daily

Chart Prepared by David Song, Strategist; USD/JPY on TradingView
- USD/JPY broke out of a bull-flag formation following the failed attempt to push below the 50-Day SMA (145.82), and the exchange rate may further retrace the decline from the 2023 high (151.91) as the moving average develops a positive slope.
- A break/close above the 151.95 (2022 high) to 152.25 (July 1990 high) region opens up 153.50 (50% Fibonacci extension), but the Relative Strength Index (RSI) may show the bullish momentum abating as it struggles to push above 70.
- Failure to test the 2023 high (151.91) may continue to pull the RSI away from overbought territory, with a break/close below the 149.40 (100% Fibonacci extension) to 150.30 (61.8% Fibonacci extension) area bringing the 145.90 (50% Fibonacci extension) to 146.70 (78.6% Fibonacci retracement) region on the radar, which incorporates the monthly low (145.90).
Additional Market Outlooks
US Dollar Forecast: EUR/USD Susceptible to Another Test of December Low
US Dollar Forecast: USD/CAD Fails to Close Below 50-Day SMA
--- Written by David Song, Strategist
Follow on Twitter at @DavidJSong


