US Dollar Outlook: USD/JPY
USD/JPY snaps the series of higher highs and lows carried over from last week as it reverses from a fresh yearly high (147.37), and the failed attempt to test the November 2022 high (148.83) may lead to a larger pullback in the exchange rate as the Relative Strength Index (RSI) diverges with price.
USD/JPY Outlook Mired by Failure to Test November 2022 High
USD/JPY struggles to hold its ground as the ADP Employment report shows a 177K rise in August versus forecasts for a 195K print, while the US 2Q Gross Domestic Product (GDP) report reveals a 2.1% rise in the growth rate amid projections for a 2.4% expansion.
It remains to be seen if the Federal Reserve will respond to the batch of weaker-than-expected data prints as Chairman Jerome Powell pledges to ‘raise rates further if appropriate,’ but signs of a slowing economy may continue to produce headwinds for the US Dollar as it fuels speculation for a looming change in regime.
Join David Song for the Weekly Fundamental Market Outlook webinar. David provides a market overview and takes questions in real-time. Register Here
US Economic Calendar

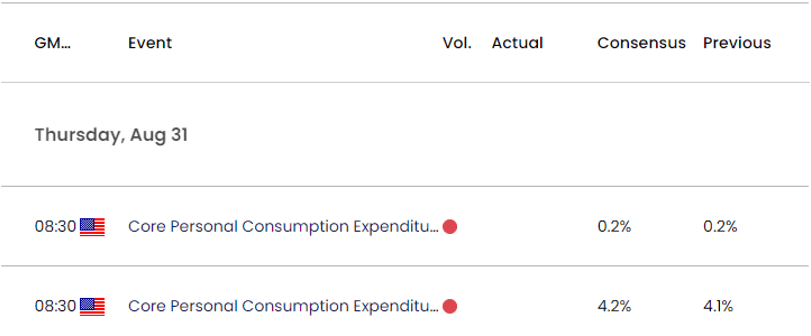
Nevertheless, the recent weakness in USD/JPY may end up being short-lived as the update to the US Personal Consumption Expenditure (PCE) Price Index, the Fed’s preferred gauge for inflation, is expected to increase to 4.2% in July from 4.1% per annum the month prior.
Evidence of persistent price growth may curb the recent weakness in USD/JPY as it encourages the FOMC to further combat inflation, but a softer-than-expected PCE print may keep the exchange rate under pressure ahead of the Non-Farm Payrolls (NFP) report as it as the central bank appears to be nearing the end of its hiking-cycle.
With that said, the opening range for September is in focus for USD/JPY amid the key data prints on tap for the remainder of the week, but the failed attempt to test the November 2022 high (148.83) may lead to a larger pullback in the exchange rate as the Relative Strength Index (RSI) diverges with price.
USD/JPY Price Chart – Daily

Chart Prepared by David Song, Strategist; USD/JPY on TradingView
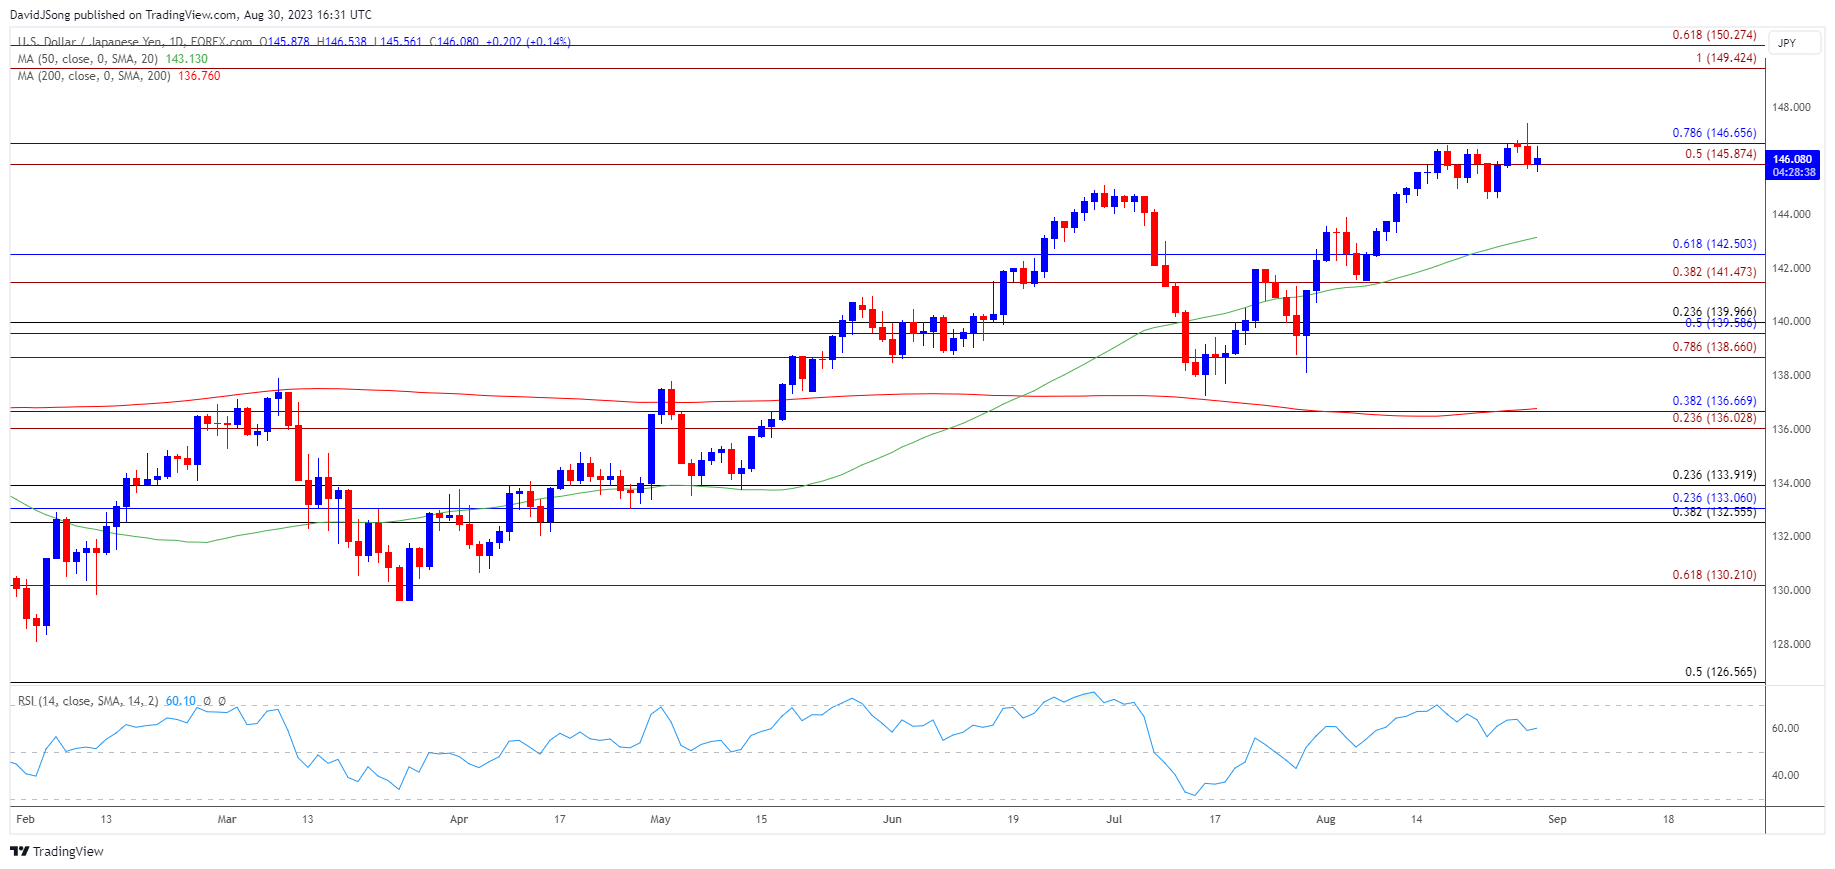
- The recent rally in USD/JPY seems to have stalled ahead of the November 2022 high (148.83) as it snaps the series of higher highs and lows carried over from last week, and lack of momentum to close above the 145.90 (50% Fibonacci extension) to 146.70 (78.6% Fibonacci retracement) region may lead to a larger pullback in the exchange rate as the Relative Strength Index (RSI) diverges with price.
- Unlike the price action from earlier this year, the recent rally in USD/JPY failed to push the RSI above 70, and the recent weakness in the exchange rate may lead to a test of the 50-Day SMA (143.13) as the oscillator continues to move away from overbought territory.
- A breach below the moving average may lead to a test of the monthly low (141.52), with a break/close below the 141.50 (38.2% Fibonacci extension) to 142.50 (61.8% Fibonacci retracement) zone bringing the 138.70 (78.6% Fibonacci extension) to 140.00 (23.6% Fibonacci retracement) area back on the radar.
- At the same time, the recent weakness in USD/JPY may end up being short-lived in it responds to the positive slope in the moving average, with a close above the 145.90 (50% Fibonacci extension) to 146.70 (78.6% Fibonacci retracement) region raising the scope for a test of the November 2022 high (148.83).
Additional Market Outlooks:
GBP/USD Vulnerable to Head-and-Shoulders Pattern
USD/JPY Pullback Keeps RSI Out of Overbought Territory
--- Written by David Song, Strategist
Follow on Twitter at @DavidJSong


