Japanese Yen Outlook: USD/JPY
USD/JPY approaches the weekly low (140.70) following the weaker-than-expected US Non-Farm Payrolls (NFP) report, and the exchange rate may continue to give back the advance from last month’s low (137.24) amid the failed attempt to test the June high (145.07).
USD/JPY Outlook Mired by Failure to Test June High
USD/JPY initiates a series of lower highs and lows as the NFP report shows a 187K rise in July versus projections for a 200K print, and data prints coming out of the US may continue to sway the exchange rate as the Consumer Price Index (CPI) is anticipated to show a further slowdown in inflation.
Join David Song for the Weekly Fundamental Market Outlook webinar. David provides a market overview and takes questions in real-time. Register Here
US Economic Calendar

The core CPI is expected to narrow to 4.7% in July from 4.8% per annum the month prior, and evidence of easing price growth may produce headwinds for the US Dollar as it encourages the Federal Reserve to end its hiking-cycle.

Source: CME
In turn, USD/JPY may continue to give back the advance from the June low (137.24) as the CME FedWatch Tool now reflects a greater than 70% probability of seeing US interest rates on hold for the remainder of the year, but a stronger-than-expected CPI report may generate a bullish reaction in the Greenback as it puts pressure on the Federal Open Market Committee (FOMC) to further combat inflation.
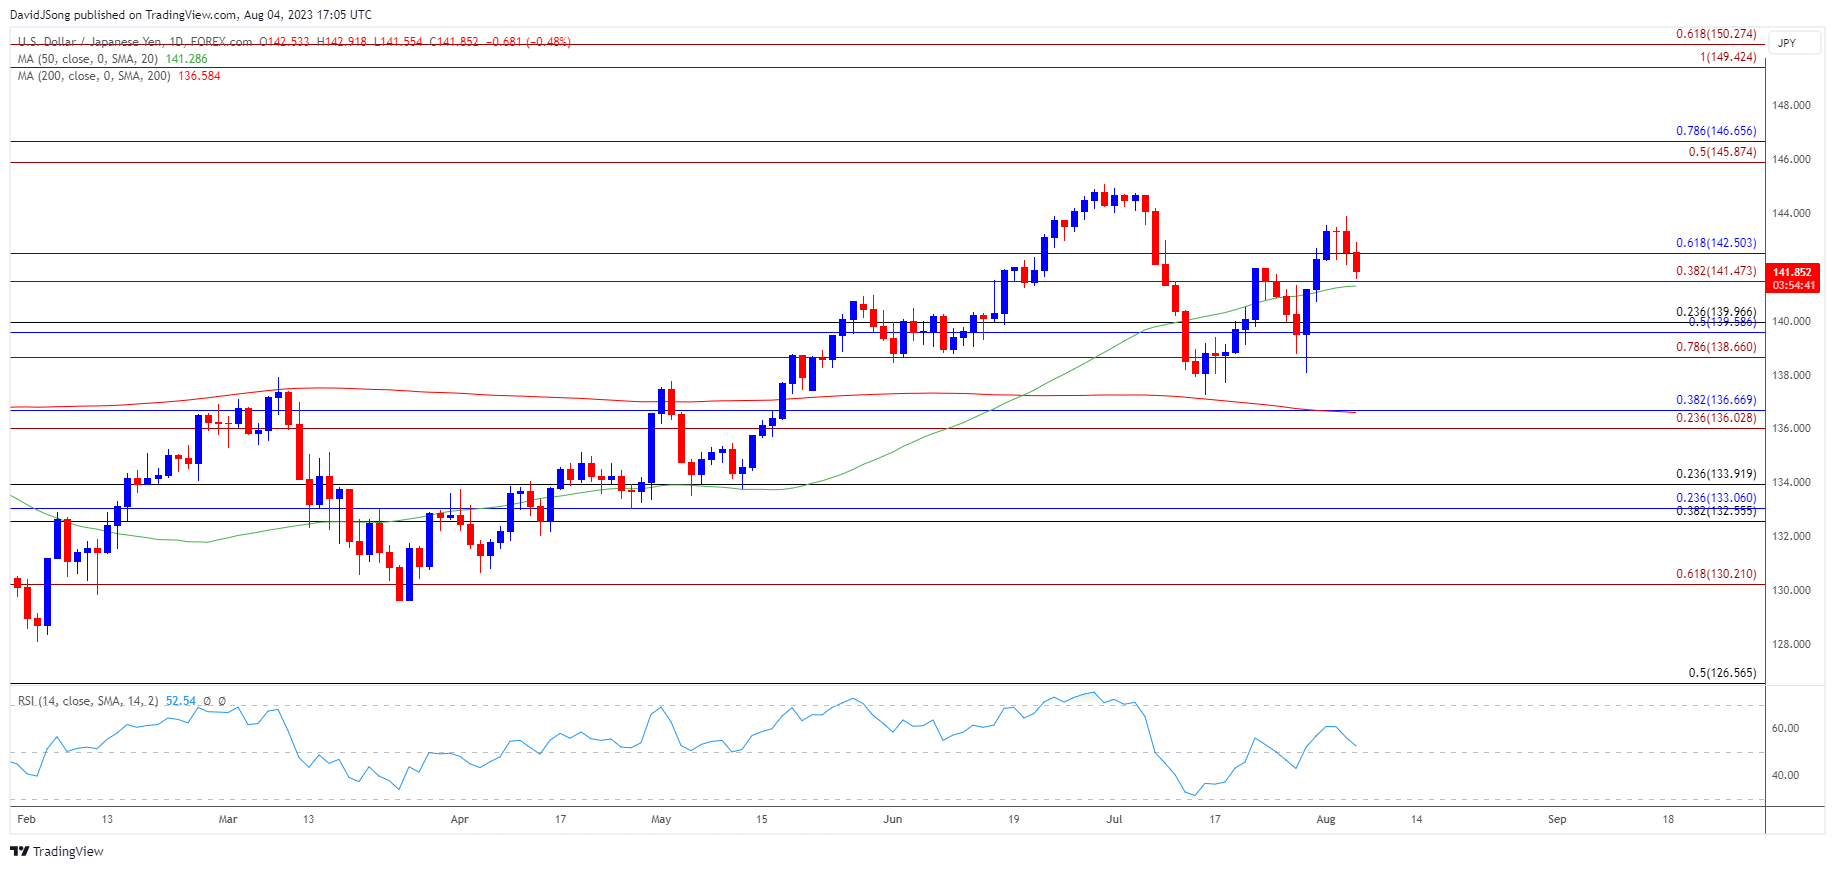
With that said, the price action during the monthly open raises the scope for a further decline in USD/JPY as it initiates a series of lower highs and lows, and the exchange rate may struggle to retain the advance from last month’s low (137.24) as it seems to be reversing ahead of the June high (145.07).
Japanese Yen Price Chart – USD/JPY Daily

Chart Prepared by David Song, Strategist; USD/JPY on TradingView
- USD/JPY falls toward the 50-Day SMA (141.29) following the failed attempt to test the June high (145.07), with a move below the moving average bringing the 138.70 (78.6% Fibonacci extension) to 140.00 (23.6% Fibonacci retracement) region on the radar.
- Failure to defend the July low (137.24) opens up the 136.00 (23.6% Fibonacci extension) to 136.70 (38.2% Fibonacci retracement) area, but USD/JPY may attempt to track the positive slope in the moving average as it holds above the 141.50 (38.2% Fibonacci extension) to 142.50 (61.8% Fibonacci retracement) zone.
- Need a breach above the monthly high (143.89) to bring the June high (145.07) back on the radar, with the next area of interest coming in around 145.90 (50% Fibonacci extension) to 146.70 (78.6% Fibonacci retracement).
Additional Market Outlooks:
GBP/USD Post-BoE Weakness Undermines Rebound from June Low
EUR/USD Dips Below 50-Day SMA Ahead of US NFP Report
--- Written by David Song, Strategist
Follow on Twitter at @DavidJSong


