Article Outline
- Key Events: Fed Rate Expectations, Tech Sector, and Non-Farm Payrolls
- Technical Analysis: USDJPY and Nasdaq (3-Day Time Frame)
- Technical Analysis (TA) Tip: Forecasting with Fibonacci Tools
2025 Fed Rate Expectations
According to the CME Fed Watch Tool, the market leans toward a 95% probability of a rate hold at the January meeting, reflecting the more hawkish-than-expected stance in the FOMC minutes regarding the rate cut trajectory for 2025. Global central banks are expressing inflation concerns tied to Trump’s presidency, leading to a cautious approach to rate cuts in 2025.

Source: CME Fed Watch Tool
Meanwhile, the strength of the US Dollar Index continues to pressure global currencies, while US indices face bearish momentum amid 2025 uncertainties. Earnings results later this month are expected to increase volatility risks for US indices. A positive performance in the tech sector may spur another Nasdaq rally despite ongoing market challenges in 2025.
USDJPY
In currency markets, the strong dollar exerts significant pressure on global currencies, particularly the Japanese Yen, which is approaching record lows and raising BOJ intervention risks. The USDJPY pair is currently trading near 158, with the 160-level looming ahead. This critical level could prompt BOJ intervention, triggering potential volatility spikes.
Technical Analysis: Quantifying Uncertainties
USDJPY Forecast: 3Day Time Frame – Log Scale

Source: Tradingview
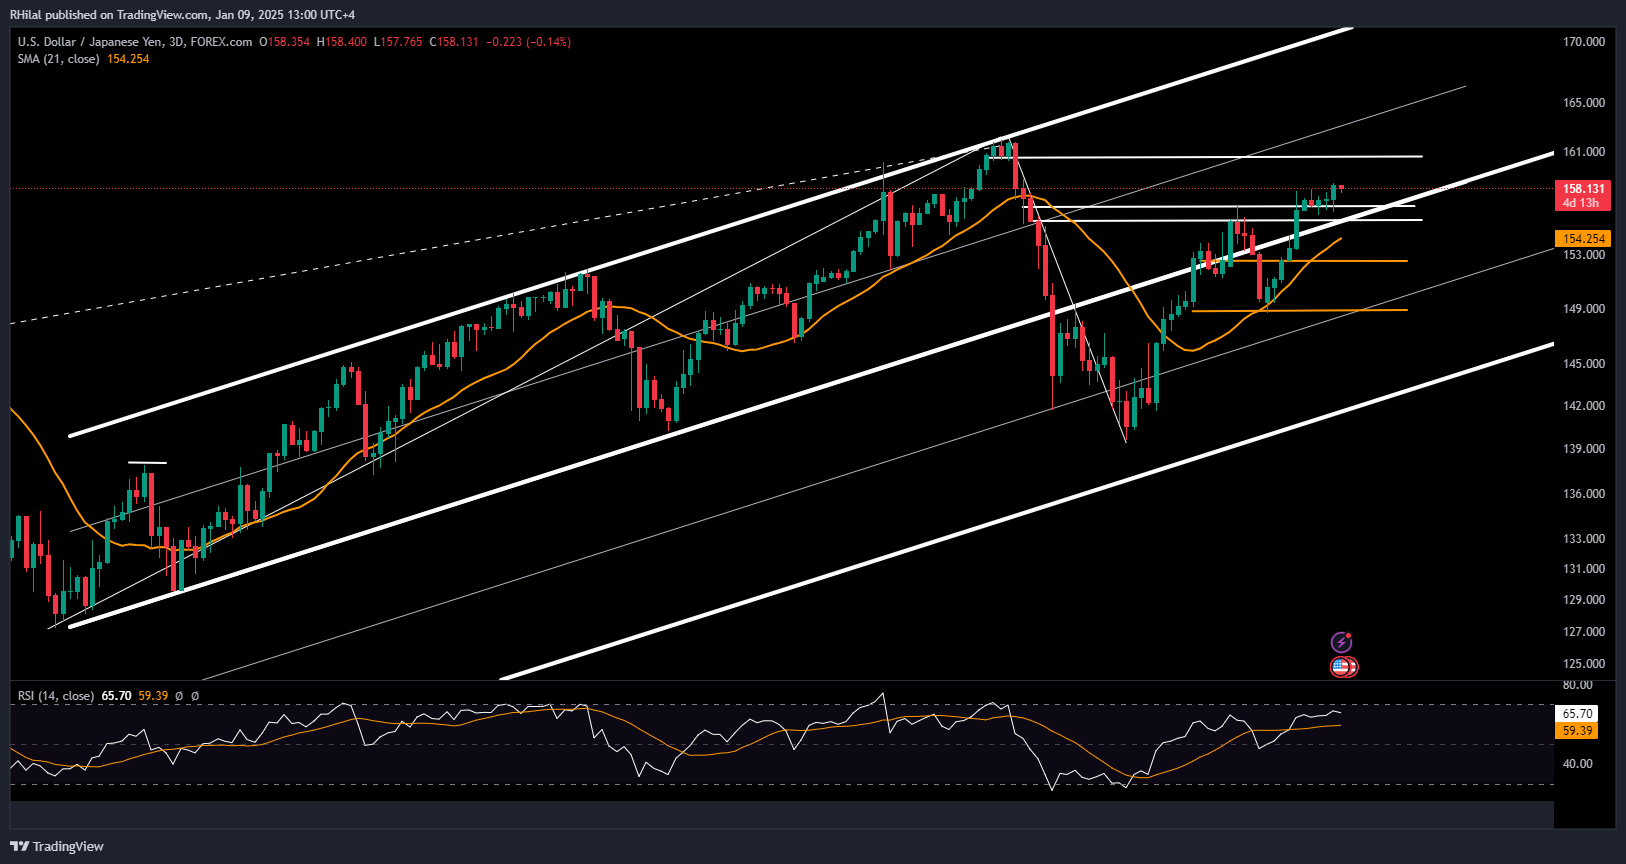
The USDJPY pair reflects bullish potential, maintaining alignment with its primary up trending channel since 2023 and trading above its 21-day SMA. Using the Fibonacci extension tool applied to the 2023 low, 2024 high, and 2024 low, the levels of 0.236 and 0.5 align with key levels at 148.60 and 156.70.
The next significant level, at the 0.618 Fibonacci extension, aligns with the 160-mark, where the RSI is expected to reach extreme overbought levels, increasing the risk of BOJ intervention and potential reversals.
On the downside, 156.70 and 155.50 act as key support levels, aligning with the trendline connecting consecutive lows from January 2023 to August 2024. A break below these levels and the primary trendline could deepen bearish sentiment, with the next support levels anticipated around 153.50 and 149, signaling potential Yen strength recovery.
Nasdaq Forecast: 3Day Time Frame – Log Scale

Source: Tradingview
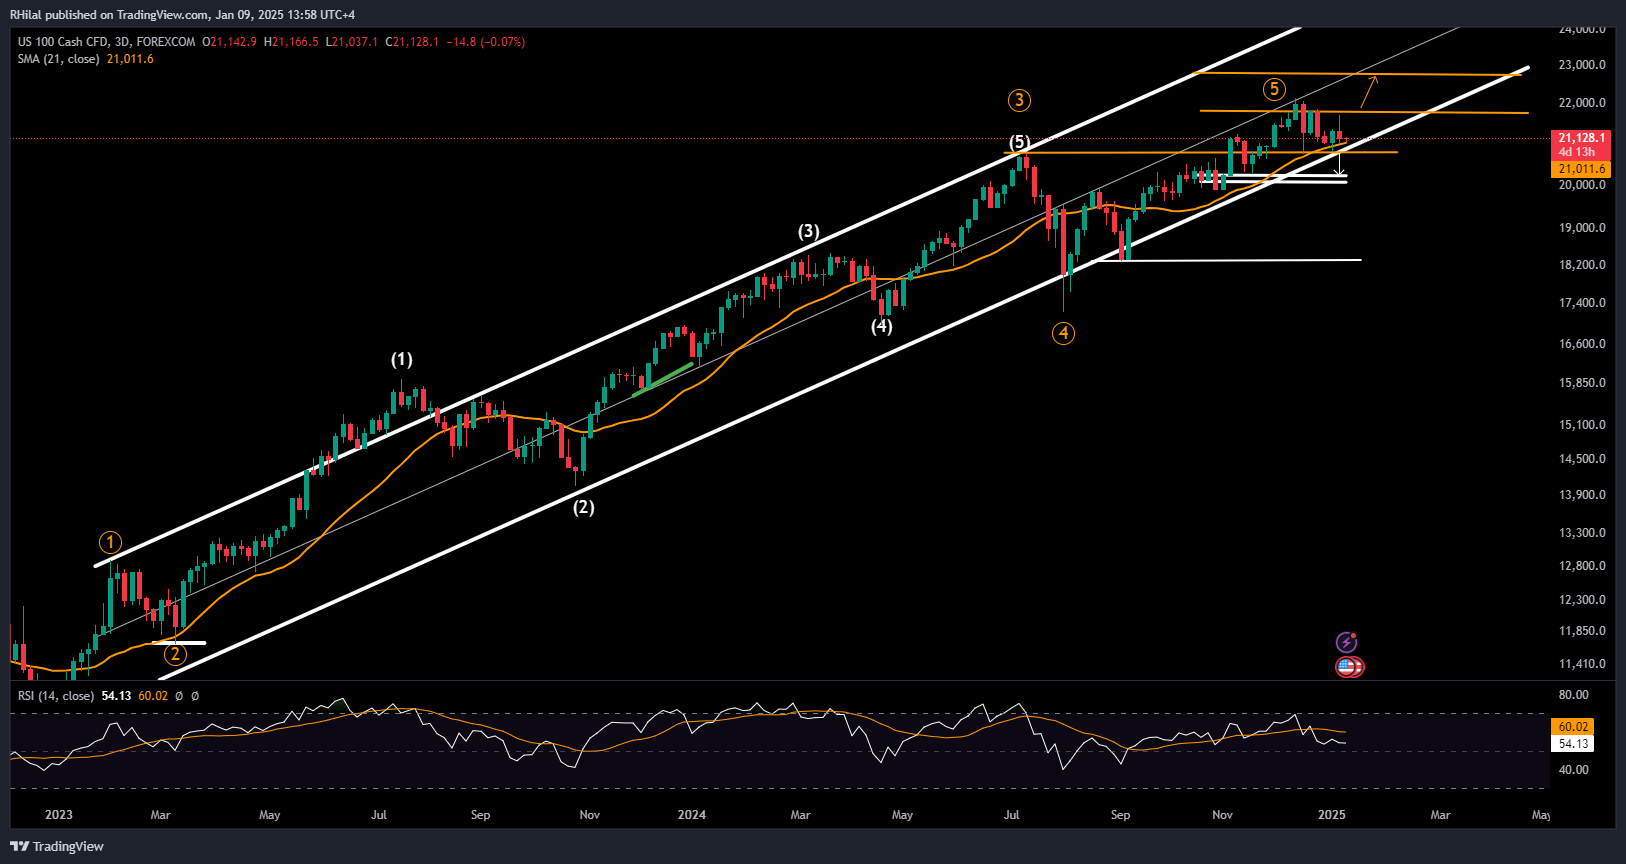
The Nasdaq's uptrend continues to respect the borders of its primary ascending channel, established from the 2022 lows. Applying the Fibonacci retracement tool to the uptrend from the August 2024 low (17,200) to the 2024 high (22,130), potential declines below the 20,700-mark can be assessed.
The recent low at 20,780 found support at the channel's bottom border and the July 2024 high. A break below the 20,700 support is necessary to shift sentiment toward bearish territory, with further declines potentially extending toward 20,200, 20,000, and 19,700.
On the upside, applying the Fibonacci extension tool to the March 2023 low, July 2024 high, and August 2024 low, a sustained close above the 21,800 or 22,000-mark could trigger a rally toward the 0.618 Fibonacci extension level near 22,880.
Written by Razan Hilal, CMT
Follow on X: @Rh_waves
On You tube: Forex.com


