US Dollar Outlook: USD/JPY
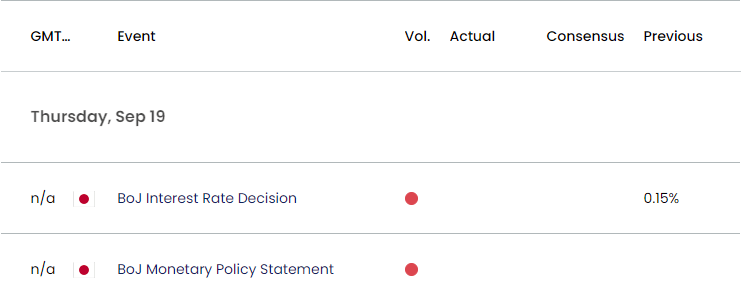
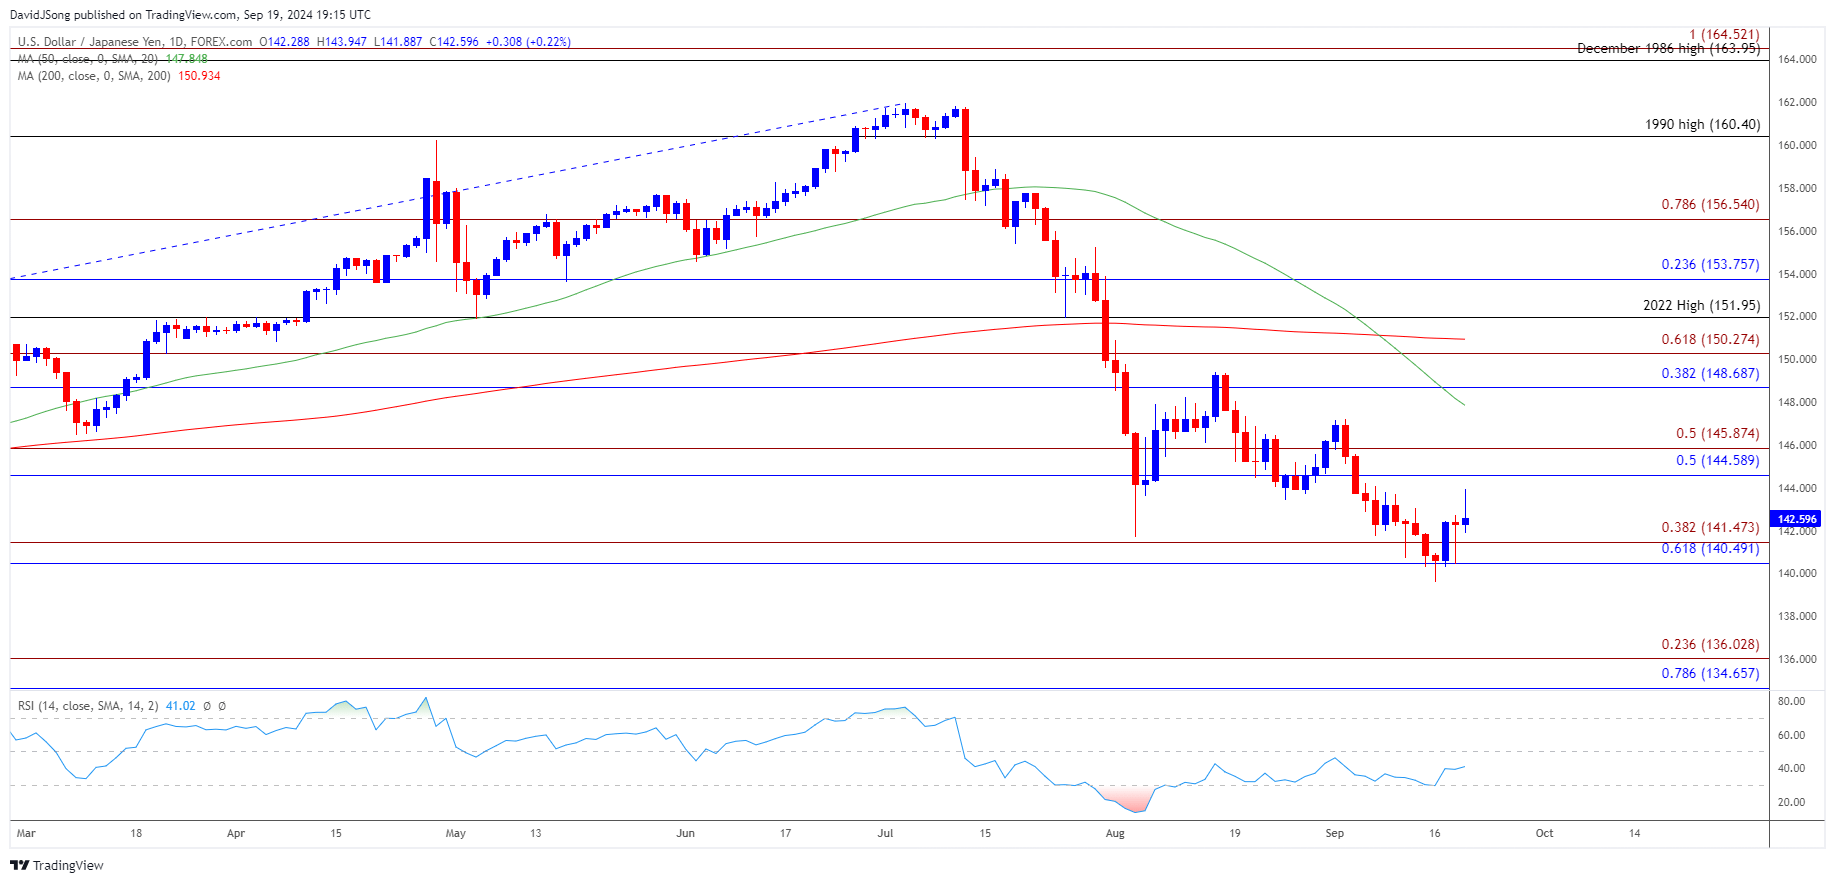
USD/JPY trades to a fresh weekly high (1443.95) ahead of the Bank of Japan (BoJ) interest rate decision, and the exchange rate may further retrace the decline from the monthly high (147.21) as the Relative Strength Index (RSI) moves away from oversold territory.
USD/JPY Forecast: RSI Moves Away from Oversold Zone Ahead of BoJ
USD/JPY extends the recent series of higher highs and lows even as the Federal Reserve delivers a 50bp rate-cut, and the exchange rate may mirror the price action from the end of last year as the RSI failed to reflect the extreme reading from the previous month.
Join David Song for the Weekly Fundamental Market Outlook webinar. David provides a market overview and takes questions in real-time. Register Here
Nevertheless, speculation for a further shift in Fed policy may continue to influence the carry trade as Chairman Jerome Powell and Co. project a lower trajectory for US interest rates, and it remains to be seen if the Bank of Japan (BoJ) will also adjust its stance as Governor Kazuo Ueda and Co. insists that ‘if the outlook for economic activity and prices presented in the July Outlook Report will be realized, the Bank will accordingly continue to raise the policy interest rate and adjust the degree of monetary accommodation.’
Japan Economic Calendar

With that said, the BoJ rate decision may lead to a further unwinding of the carry trade should the central bank implement higher interest rates, but USD/JPY may attempt to further retrace the decline from the monthly high (147.21) if the central bank sticks to its current policy.
USD/JPY Price Chart – Daily

Chart Prepared by David Song, Strategist; USD/JPY on TradingView
- USD/JPY may mirror the price action from the end of 2023 amid the failed attempt to close below the 140.50 (61.8% Fibonacci retracement) to 141.50 (38.2% Fibonacci extension) region, with a breach above the 144.60 (50% Fibonacci retracement) to 145.90 (50% Fibonacci extension) area raising the scope for a test of the monthly high (147.21).
- Next region of interest comes in around 148.70 (38.2% Fibonacci extension) but the recent rebound in USD/JPY may end up short-lived if it responds the negative slope in the 50-Day SMA (147.85).
- Need a close below the 140.50 (61.8% Fibonacci retracement) to 141.50 (38.2% Fibonacci extension) region to open up the July 2023 low (137.24), with the next area of interest coming in around 134.70 (78.6% Fibonacci retracement) to 136.00 (23.6% Fibonacci extension).
Additional Market Outlooks
USD/CAD Vulnerable as Post-Fed Weakness Persists
AUD/USD on Cusp of Testing August High following Fed Rate Cut
EUR/USD Struggles to Test Monthly High Ahead of Fed Rate Decision
GBP/USD Bull-Flag Starts to Unfold ahead of Fed and BoE Rate Decision
--- Written by David Song, Strategist
Follow on Twitter at @DavidJSong


