USD/JPY Outlook
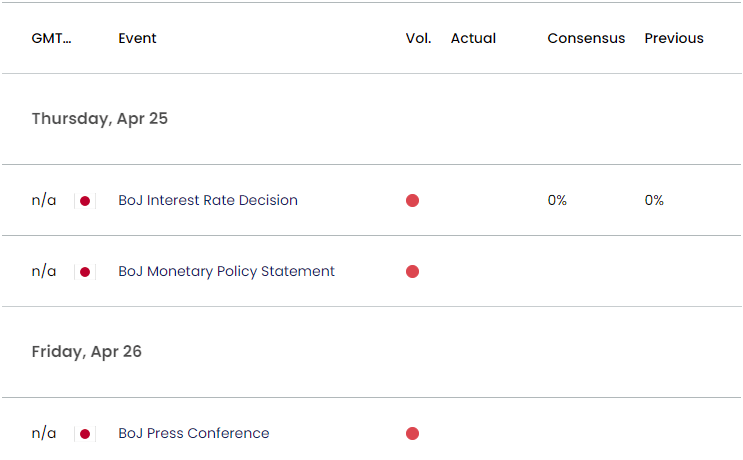
USD/JPY trades to a fresh yearly high (154.85) to keep the Relative Strength Index (RSI) in overbought territory, with the exchange rate still susceptible to a test of the June 1990 high (155.80) as the Bank of Japan (BoJ) is anticipated to retain the current policy.
USD/JPY Forecast: RSI Holds in Overbought Zone Ahead of BoJ Meeting
USD/JPY seems to be mirroring the recent rise in long-term US Treasury yields as Federal Reserve officials acknowledge the lack of progress in bringing down inflation to the 2% target, and the exchange rate may continue to track the positive slope in the 50-Day SMA (151.00) as it holds above the former resistance zone around the July 1990 high (152.25).
Join David Song for the Weekly Fundamental Market Outlook webinar. David provides a market overview and takes questions in real-time. Register Here
At the same time, the BoJ appears to be in no rush to pursue a hiking-cycle as the central bank is expected to retain the benchmark interest rate within the current threshold of 0.0% to 0.10%, and more of the same from Governor Kazuo Ueda and Co. may keep USD/JPY afloat as ‘the Bank anticipates that accommodative financial conditions will be maintained for the time being.’
Japan Economic Calendar

However, the BoJ may further adjust its forward guidance for monetary policy as the central bank warns that ‘it is highly likely that wages will continue to increase steadily this year,’ and hints of a looming change in regime may drag on USD/JPY as the Federal Open Market Committee (FOMC) keeps the door open to adopt a less restrictive policy in 2024.
Until then, it remains to be seen if Japanese authorities will intervene in foreign exchange markets as USD/JPY trades to a fresh yearly high (154.85), and the US Dollar may continue to outperform against its Japanese counterpart amid the diverging paths between the Fed and BoJ.
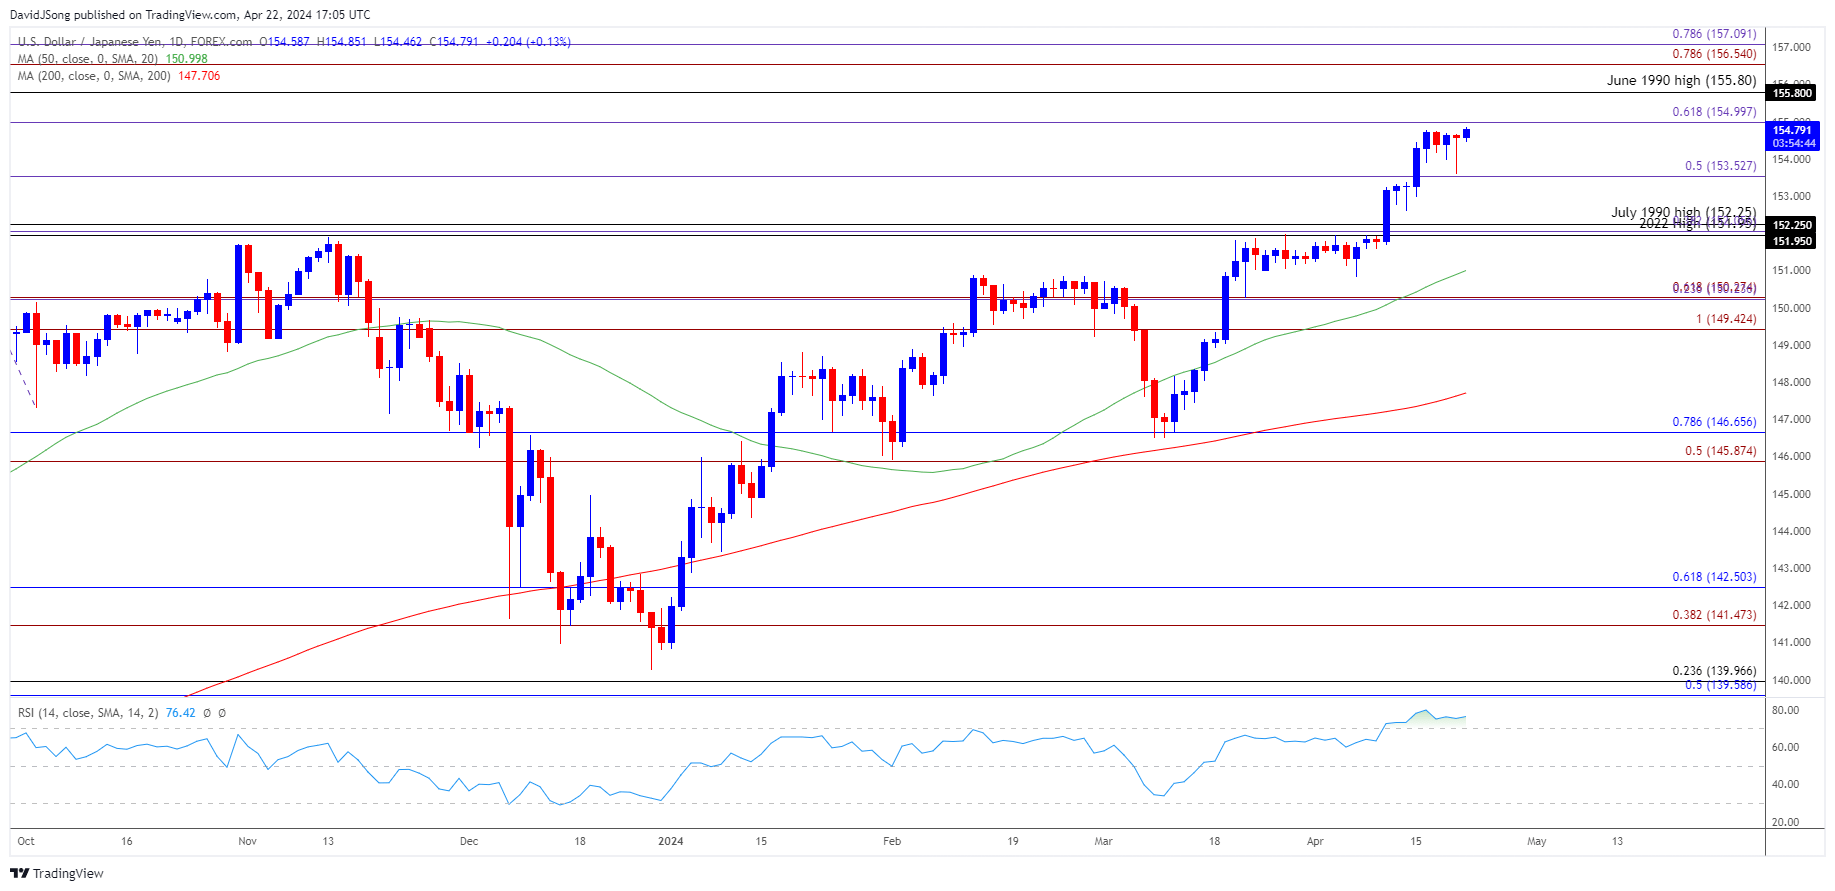
With that said, USD/JPY may stage further attempts to test the June 1990 high (155.80) as the Relative Strength Index (RSI) holds in overbought territory, but a move below 70 in the oscillator is likely to be accompanied by a near-term pullback in the exchange rate like the price action from last year.
USD/JPY Price Chart – Daily

Chart Prepared by David Song, Strategist; USD/JPY on TradingView
- Keep in mind, the recent advance in USD/JPY pushed the Relative Strength Index (RSI) into overbought territory for the first time in 2024, and the bullish momentum may persist as the exchange rate holds above the former resistance zone around the July 1990 high (152.25).
- Need a break/close above 155.00 (61.8% Fibonacci extension) raise the scope for a test of the June 1990 high (155.80), with the next area of interest coming in around 156.50 (78.6% Fibonacci extension) to 157.10 (78.6% Fibonacci extension).
- However, lack of momentum to break/close above 155.00 (61.8% Fibonacci extension) may pull the RSI back from overbought territory, with a move below 70 in the oscillator like to be accompanied by a near-term pullback in USD/JPY like the price action from last year.
- Failure to hold above 153.50 (50% Fibonacci extension) may push USD/JPY towards the former resistance zone around the July 1990 high (152.25), with the next area of interest coming in around the monthly low (150.81).
Additional Market Outlooks
US Dollar Forecast: USD/CAD Reverses Ahead of November High
US Dollar Forecast: GBP/USD Rebound Keeps RSI Out of Oversold Zone
--- Written by David Song, Strategist
Follow on Twitter at @DavidJSong


