US Dollar Outlook: USD/JPY
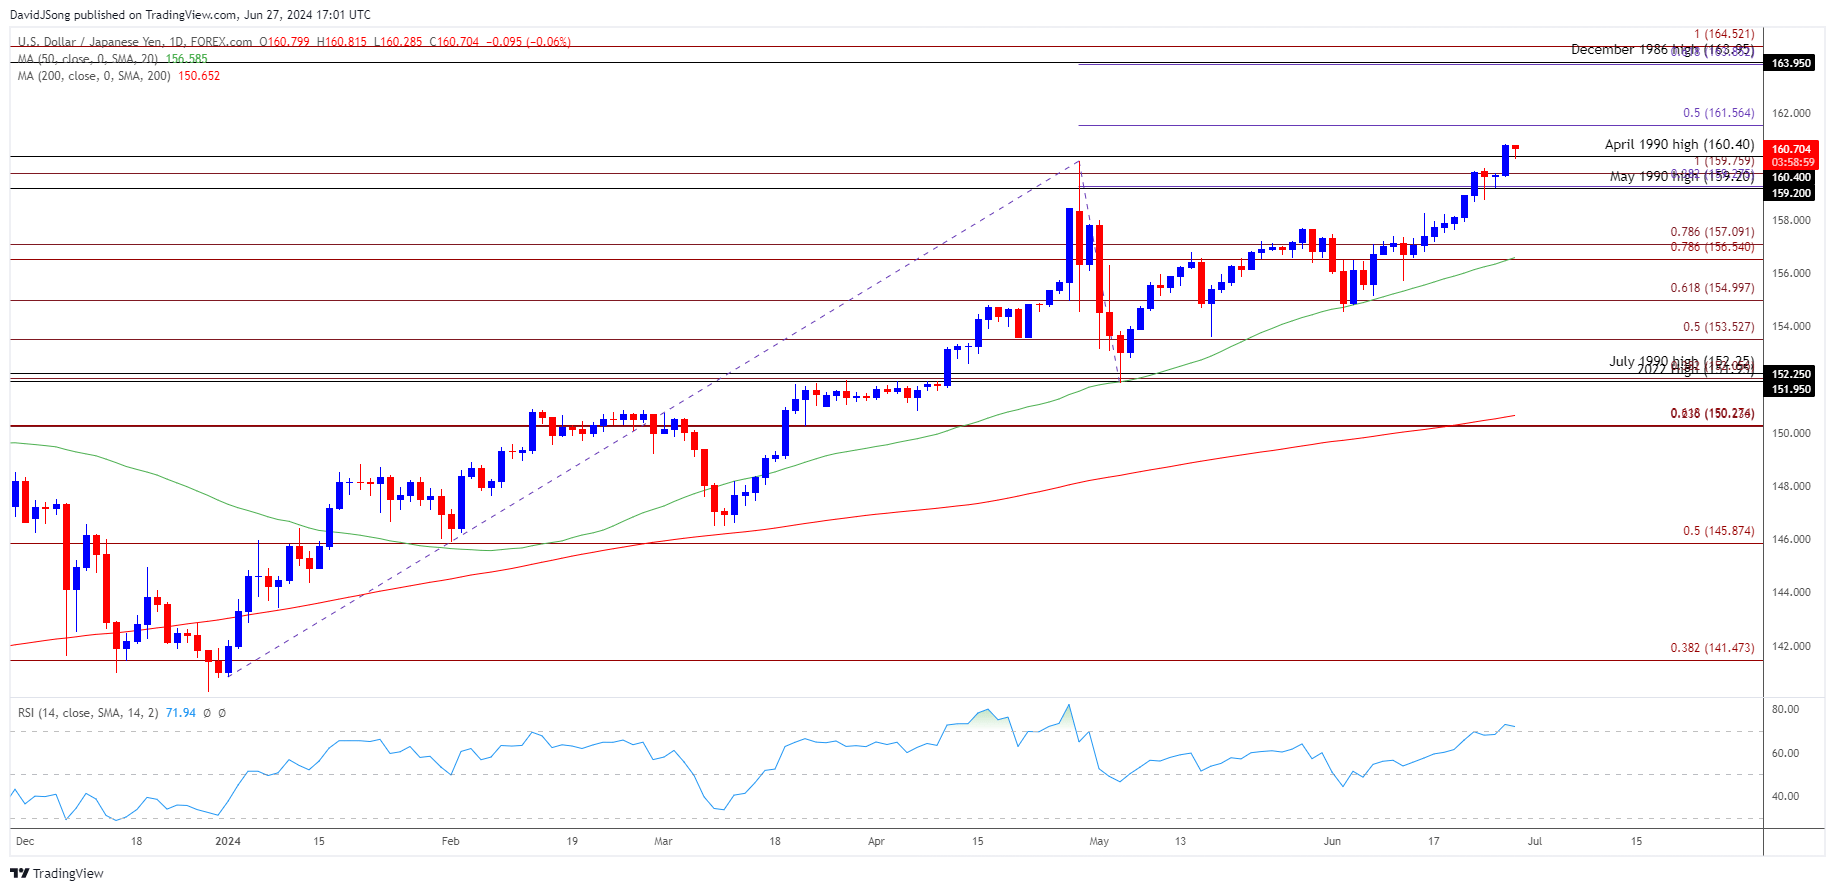
USD/JPY trades near the fresh yearly high (160.87) to keep the Relative Strength Index (RSI) above 70, and the exchange rate may continue to reflect a bullish trend as the 50-Day SMA (156.58) still shows a positive slope.
USD/JPY Forecast: RSI Holds in Overbought Territory
Keep in mind, USD/JPY remains at threat of a currency intervention as authorities in Japan warn of speculative moves in FX markets, but the overbought reading in the RSI is likely to be accompanied by a further advance in USD/JPY like the price action from earlier this year.
Join David Song for the Weekly Fundamental Market Outlook webinar. David provides a market overview and takes questions in real-time. Register Here
US Economic Calendar

Nevertheless, update to the Personal Consumption Expenditure (PCE) Price Index may sway USD/JPY as the core PCE, the Federal Reserve’s preferred gauge for inflation, is seen narrowing to 2.6% in May from 2.8% per annum the month prior.
Evidence of slowing inflation may lead to a larger pullback in USD/JPY as it fuels speculation for a Fed rate-cut, but a higher-than-expected core PCE print may prop up the exchange rate as it puts pressure on the Federal Open Market Committee (FOMC) to keep US interest rates higher for longer.
With that said, USD/JPY may continue to trade to fresh yearly highs as the Relative Strength Index (RSI) holds in overbought territory, but a larger pullback in the exchange rate may drag the oscillator below 70 to indicate a sell-signal.
USD/JPY Price Chart – Daily

Chart Prepared by David Song, Strategist; USD/JPY on TradingView
- USD/JPY cleared the 1990 high (160.40) to push the Relative Strength Index (RSI) into overbought territory, and the move above 70 in the oscillator is likely to be accompanied by a further rise in the exchange rate like the price action from earlier this year.
- A break/close above 161.60 (50% Fibonacci extension) may lead to a test of the December 1986 high (163.95) but a larger pullback in USD/JPY may drag the RSI back from overbought territory.
- Lack of momentum to hold above the 159.20 (May 1990 high) to 159.80 (100% Fibonacci extension) region may push USD/JPY back towards the 156.50 (78.6% Fibonacci extension) to 157.10 (78.6% Fibonacci extension) zone, with a breach below the 50-Day SMA (156.59) opening up 155.00 (61.8% Fibonacci extension).
Additional Market Outlooks
US Dollar Forecast: GBP/USD Falls to Fresh Monthly Low Ahead of US PCE
USD/CAD Negates Ascending Channel amid Uptick in Canada Inflation
--- Written by David Song, Strategist
Follow on Twitter at @DavidJSong


