US Dollar Outlook: USD/JPY
USD/JPY extends the advance from the start of the week to approach the monthly high (161.95), and another move above 70 in the Relative Strength Index (RSI) is likely to be accompanied by a further advance in the exchange rate like the price action from earlier this year.
USD/JPY Forecast: RSI Approaches Overbought Territory Again
USD/JPY carves a series of higher highs and lows as Federal Reserve Chairman Jerome Powell promotes a data-dependent approach in front of US lawmakers, and it seems as though the Federal Open Market Committee (FOMC) is in no rush to switch gears as the central bank continues to combat inflation.
Join David Song for the Weekly Fundamental Market Outlook webinar. David provides a market overview and takes questions in real-time. Register Here
As a result, the diverging paths between the FOMC and Bank of Japan (BoJ) may keep USD/JPY afloat as Governor Kazuo Ueda and Co. offer little hints of a rate-hike cycle, and developments coming out of the US may sway the exchange rate as Fed officials forecast that ‘the appropriate level of the federal funds rate will be 5.1 percent at the end of this year.’
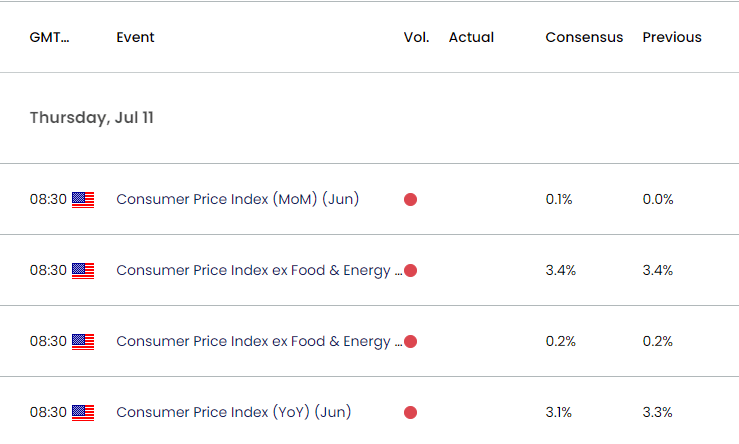
US Economic Calendar

In turn, the update to the US Consumer Price Index (CPI) may encourage the FOMC to unwind its restrictive policy should the headline and core reading show slowing inflation, and evidence of easing price growth may drag on the US Dollar as it fuels speculation for a Fed rate-cut in 2024.
At the same time, a higher-than-expected CPI print may force Chairman Powell and Co. to keep US interest rates higher for longer, and indications of persistent inflation may produce a bullish reaction in the Greenback as market participants push out bets for a change in Fed policy.
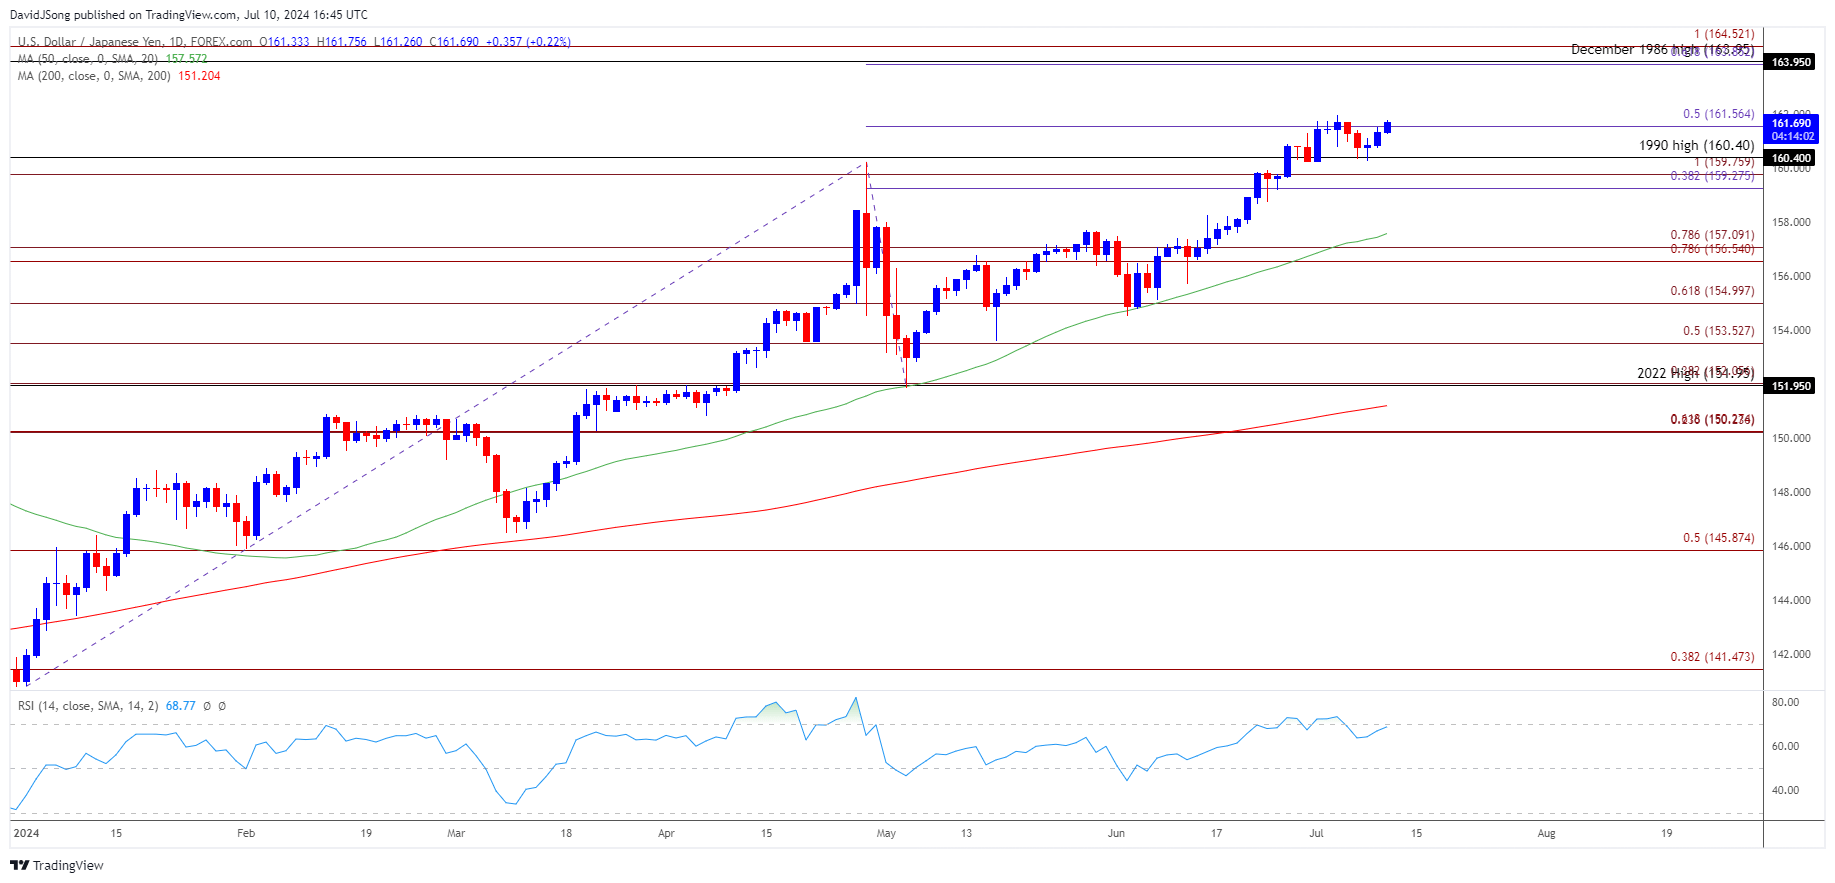
With that said, USD/JPY may test the monthly high (161.95) as it carves a series of higher highs and lows, but the Relative Strength Index (RSI) may show the bullish momentum abating if it struggles to push above 70 and starts to diverge with price.
USD/JPY Price Chart – Daily

Chart Prepared by David Song, Strategist; USD/JPY on TradingView
- USD/JPY appears to be on track to test the monthly high (161.95) as it carves a series of higher highs and lows, with another move above 70 in the Relative Strength Index (RSI) likely to be accompanied by a further advance in the exchange rate like the price action from earlier this year.
- A break above the opening range for July may push USD/JPY towards the 163.90 (61.8% Fibonacci extension) to 163.95 (December 1986 high) region, with the next area of interest coming in around 164.50 (100% Fibonacci extension).
- However, the RSI may show the bullish momentum abating if it struggles to push into overbought territory, and failure to defend the weekly low (160.27) may send USD/JPY back towards the 159.30 (38.2% Fibonacci extension) to 159.80 (100% Fibonacci extension) region.
Additional Market Outlooks
US Dollar Forecast: USD/CAD Defends May Low Ahead of Fed Testimony
US Dollar Forecast: GBP/USD Recovers amid Failure to Test June Low
--- Written by David Song, Strategist
Follow on Twitter at @DavidJSong


