USD/JPY Outlook
USD/JPY pulls back from a fresh yearly high(145.07) as the US Personal Consumption Expenditure (PCE) Price Index reveals slowing inflation, but the exchange rate may continue to carve a series of higher highs and lows as the Relative Strength Index (RSI) sits in overbought territory.
USD/JPY Forecast: Overbought RSI Reading Persists
The recent rally in USD/JPY has pushed the RSI to its highest level this year and the bullish momentum looks poised to persist as long as the oscillator holds above 70.
Join David Song for the Weekly Fundamental Market Outlook webinar. Register Here
As a result, USD/JPY may attempt to test the November 2022 high (148.83) as Federal Reserve officials project a steeper path for US interest rates, and the Non-Farm Payrolls (NFP) report may push the central bank to reestablish its hiking-cycle as the update is anticipated to show a further improvement in the labor market.

The US economy is anticipated to add 200K jobs in June while the Unemployment Rate is projected to hold steady at 3.7% during the same period, and ongoing signs of a tight labor market may generate a bullish reaction in the Greenback as it fuels speculation for higher interest rates.

Source: CME
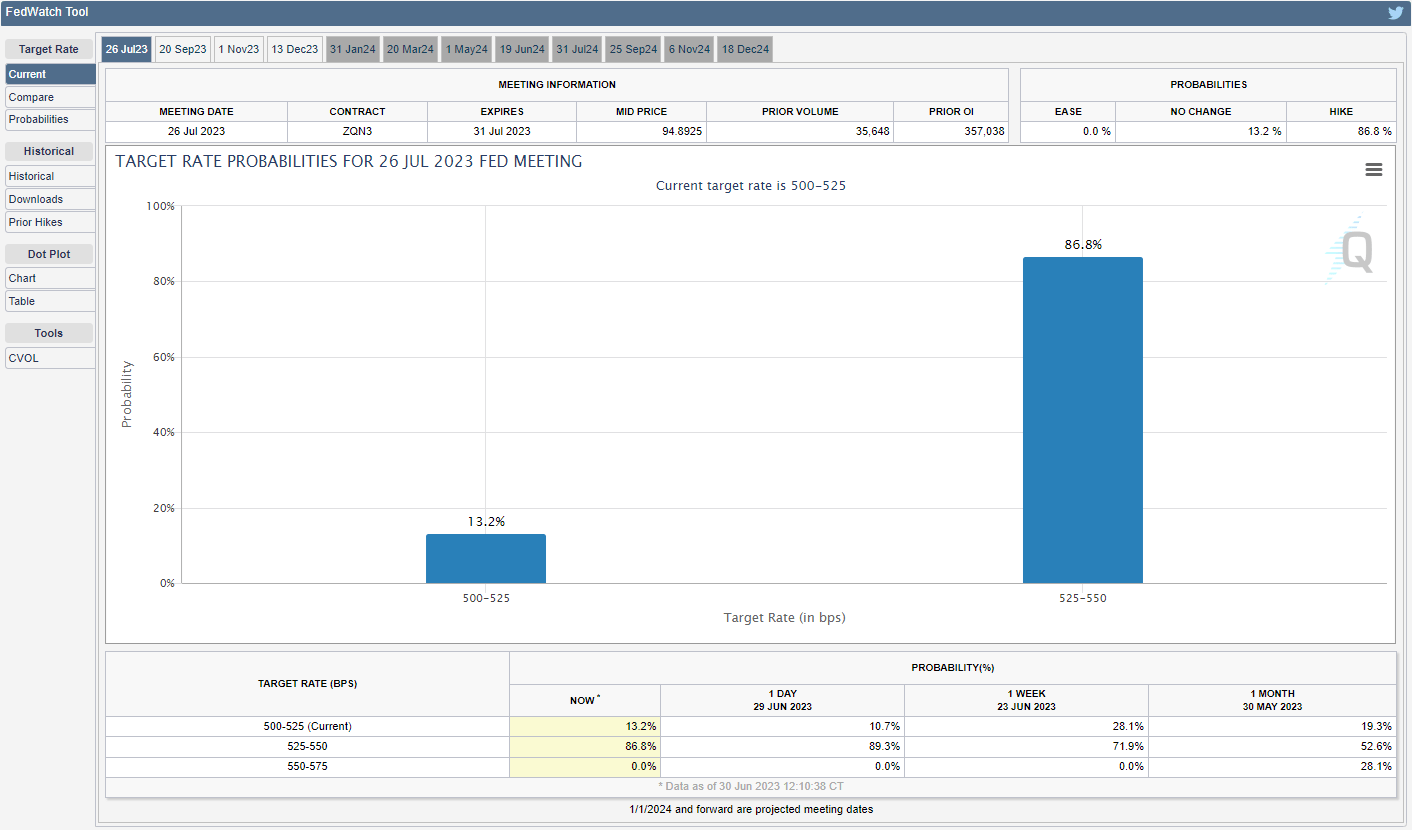
According to the CME FedWatch Tool, market participants are pricing a greater than 80% probability for a 25bp rate hike in July, and the deviating paths for monetary policy may keep USD/JPY afloat as the Bank of Japan (BoJ) sticks to Quantitative and Qualitative Easing (QQE) with Yield-Curve Control.
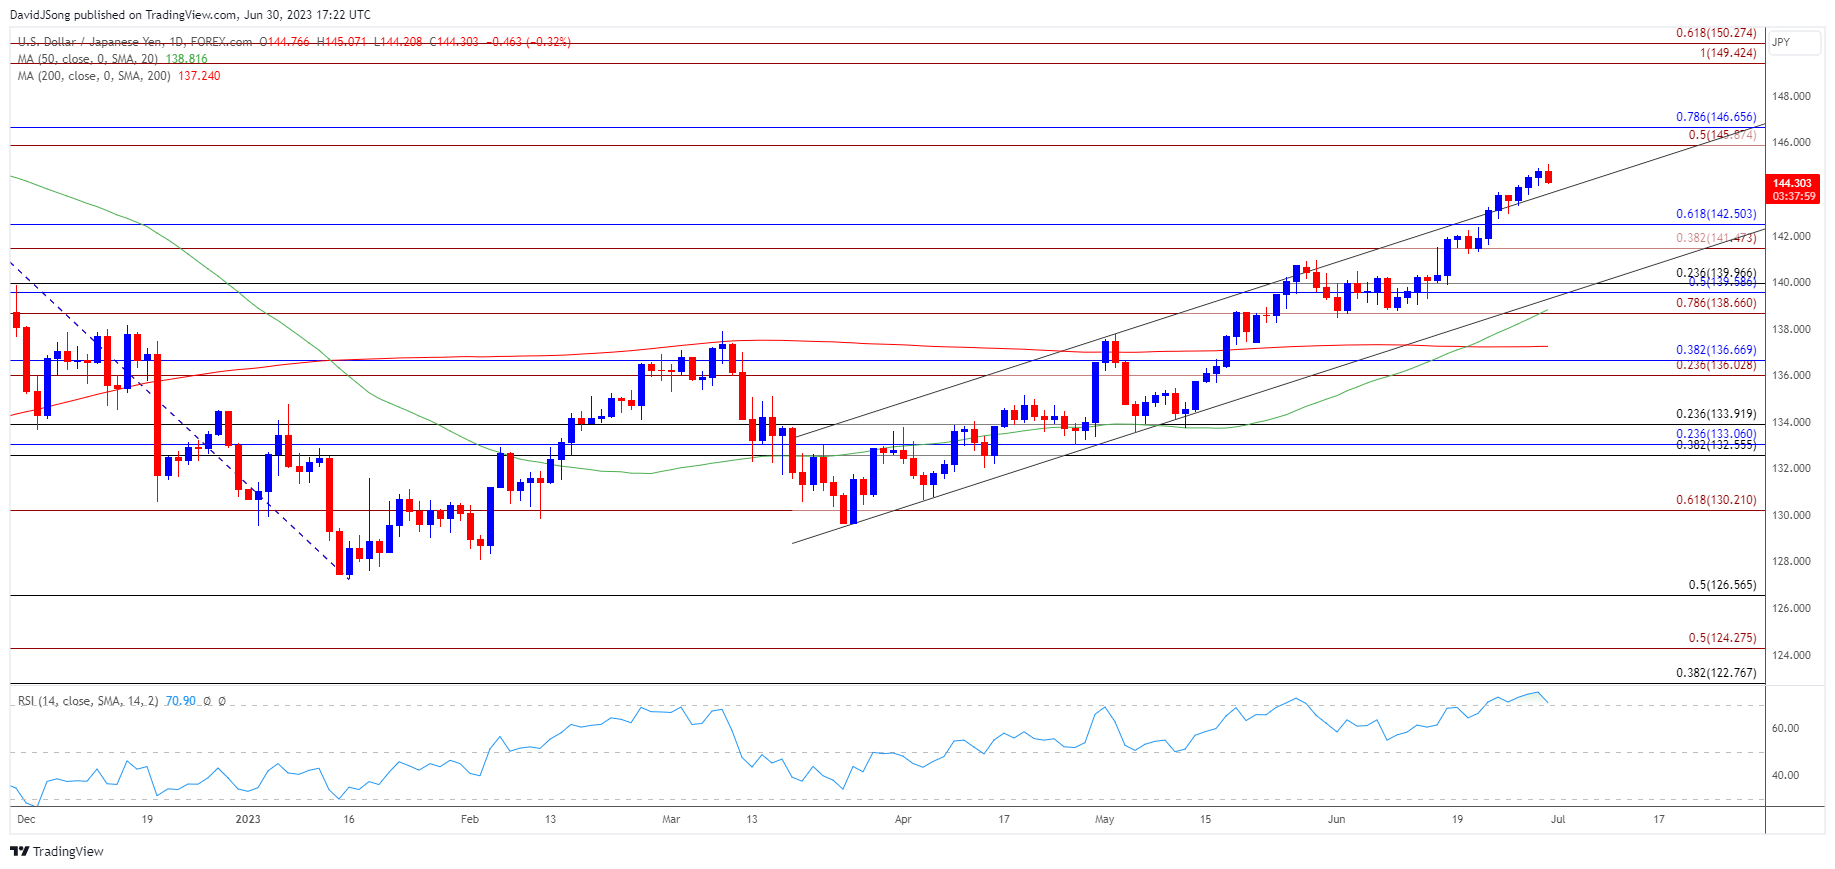
With that said, USD/JPY may appreciate ahead of the NFP report as it extends the series of higher highs and lows from earlier this week, and the exchange rate may continue to retrace the decline from the November 2022 high (148.83) as the Relative Strength Index (RSI) holds above 70.
Japanese Yen Price Chart – USD/JPY Daily

Chart Prepared by David Song, Strategist; USD/JPY on TradingView
- USD/JPY registers a fresh yearly high (145.07) ahead of July as it extends the series of higher highs and lows from earlier this week, and the exchange rate may continue to retrace the decline from the November 2022 high (148.83) as the Relative Strength Index (RSI) holds above 70.
- A break/close above 145.90 (50% Fibonacci extension) to 146.70 (78.6% Fibonacci retracement) region may push USD/JPY towards the November 2022 high (148.83), with the next area of interest coming in around 149.40 (100% Fibonacci extension) to 150.30 (61.8% Fibonacci extension).
- However, looming developments in the RSI may show the bullish momentum abating if it falls from overbought territory, with a pullback in USD/JPY bringing the 141.50 (38.2% Fibonacci extension) to 142.50 (61.8% Fibonacci retracement) zone back on the radar.
Additional Market Outlooks:
USD/CAD Forecast: Test of Former Support in Focus
GBP/USD Susceptible to Test of 50-Day SMA
--- Written by David Song, Strategist
Follow on Twitter at @DavidJSong


