US Dollar Outlook: USD/JPY
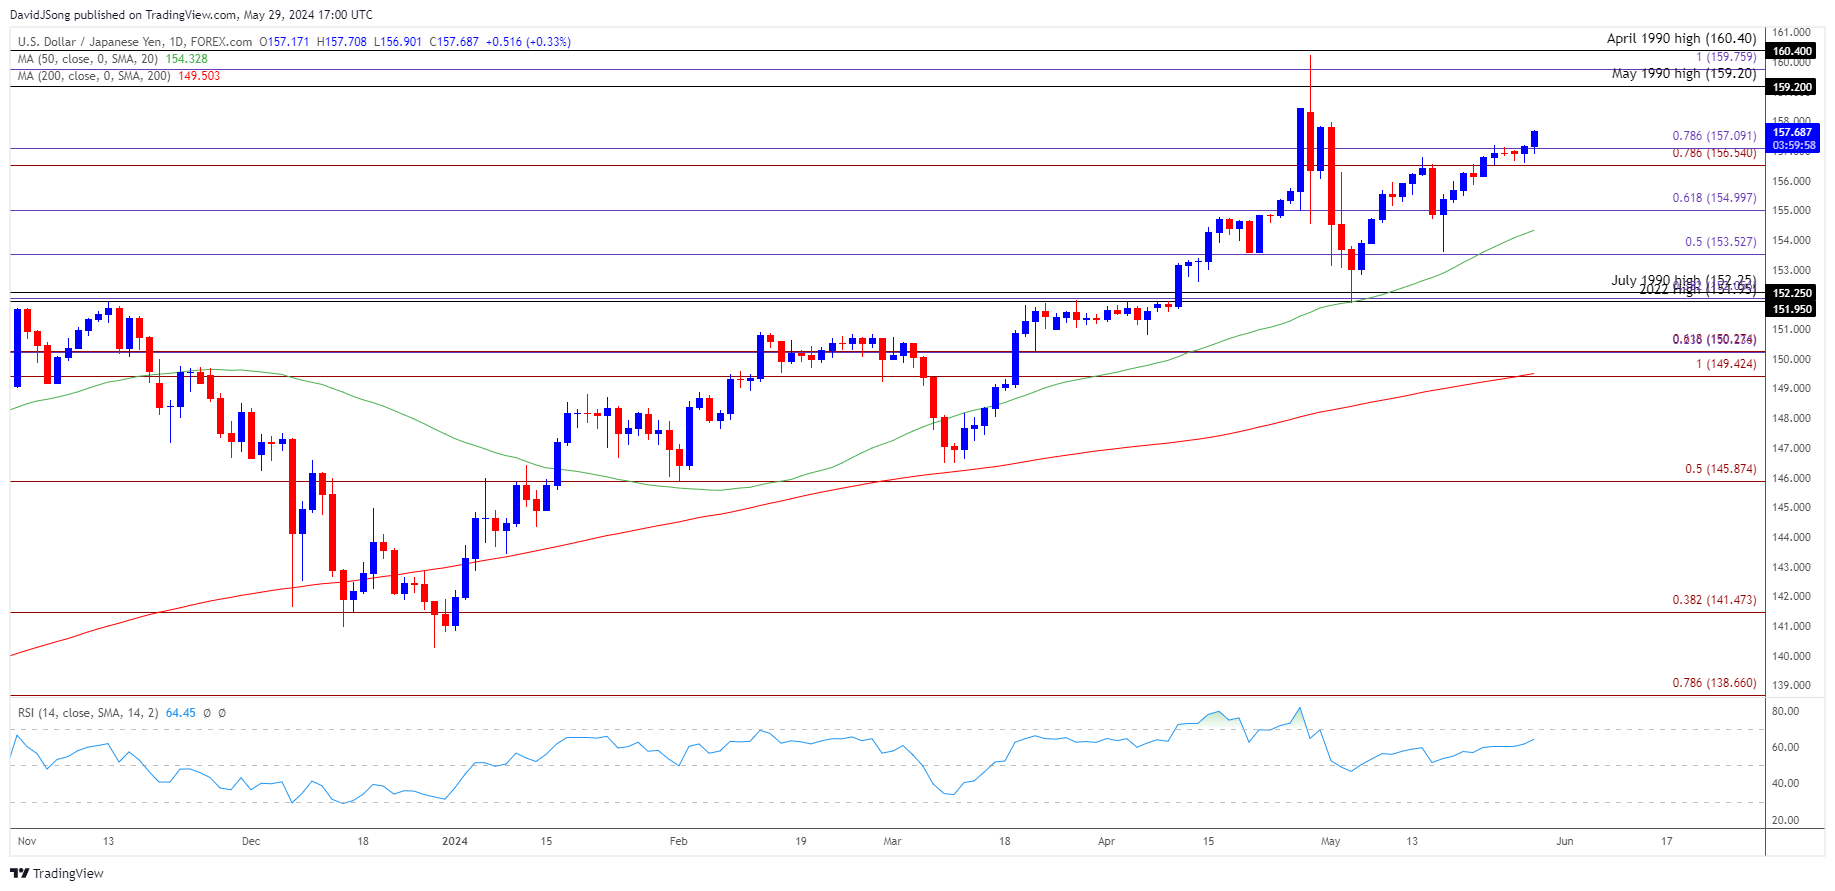
USD/JPY stages a two-day rally to clear last week’s high (157.20), and the exchange rate may further retrace the decline from the monthly high (157.99) as it seems to be tracking the positive slope in the 50-Day SMA (154.32).
USD/JPY Eyes Monthly High Ahead of US PCE Report
USD/JPY appeared to be stuck in a narrow range as it struggled to extend the advance following the Federal Open Market Committee (FOMC) Minutes, and the exchange rate may hold within the opening range for May amid the ongoing threat of a currency intervention by Japanese officials.
Join David Song for the Weekly Fundamental Market Outlook webinar. David provides a market overview and takes questions in real-time. Register Here
Nevertheless, the diverging paths between the Bank of Japan (BoJ) and Federal Reserve may keep USD/JPY as Governor Kazuo Ueda and Co. show little interest in pursuing a hiking-cycle, and the BoJ may continue to sit on the sidelines as Japan’s Gross Domestic Product (GDP) report showed the economy contracting 0.5% in the first quarter of 2024.
At the same time, the Fed may stick to its restrictive policy as the central bank acknowledges a lack of progress in achieve the 2% target for inflation, and it remains to be seen if FOMC will adjust the forward guidance for monetary policy as the update to the Personal Consumption Expenditure (PCE) Price Index is anticipated to show sticky inflation.
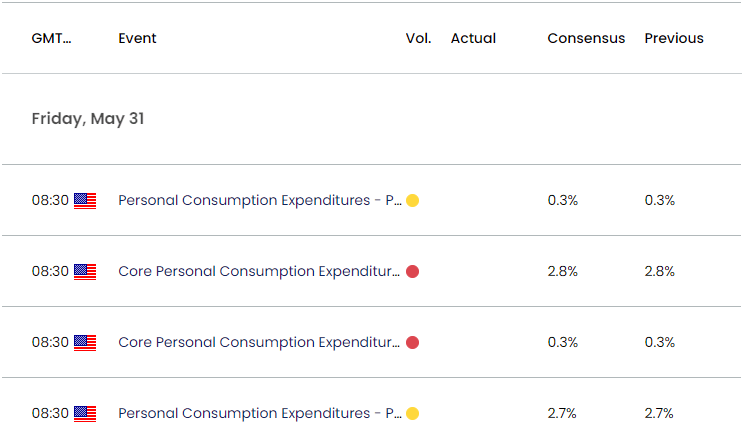
US Economic Calendar

The core PCE, the Fed’s preferred gauge for inflation, is expected to hold steady at 2.8% in April, and evidence of persistent price growth may produce a bullish reaction in the Greenback as it puts pressure on the FOMC to keep US interest rates higher for longer.
In contrast, a downtick in the core PCE may drag on the Greenback as it encourages Chairman Jerome Powell and Co. to adopt a less restrictive policy, and USD/JPY may continue to trade within the opening range for May on the back of growing speculation for a Fed rate-cut.
With that said, USD/JPY may struggle to retain the advance from earlier this week if it fails to test the monthly high (157.99), but the exchange rate may track the positive slope in the 50-Day SMA (154.32) as it continues to hold above the moving average.
USD/JPY Price Chart – Daily

Chart Prepared by David Song, Strategist; USD/JPY on TradingView
- USD/JPY approaches the monthly high (157.99) as it clears the range bound price action carried over from last week, with a break/close above the 159.20 (May 1990 high) to 159.80 (100% Fibonacci extension) region bringing the April high (160.22) on the radar.
- In turn, USD/JPY may track the positive slope in the 50-Day SMA (154.32) as it continues to hold above the moving average, with the next area of interest comes in around the April 1990 high (160.40).
- However, failure to test the monthly high (157.99) may undermine the recent advance in USD/JPY, with a breach below the 156.50 (78.6% Fibonacci extension) to 157.10 (78.6% Fibonacci extension) area raising the scope for a move towards 155.00 (61.8% Fibonacci extension).
Additional Market Outlooks
US Dollar Forecast: GBP/USD Rally Pushes RSI Towards Overbought Zone
US Dollar Forecast: AUD/USD Vulnerable amid Failure to Clear May High
--- Written by David Song, Strategist
Follow on Twitter at @DavidJSong


