USD/JPY Outlook
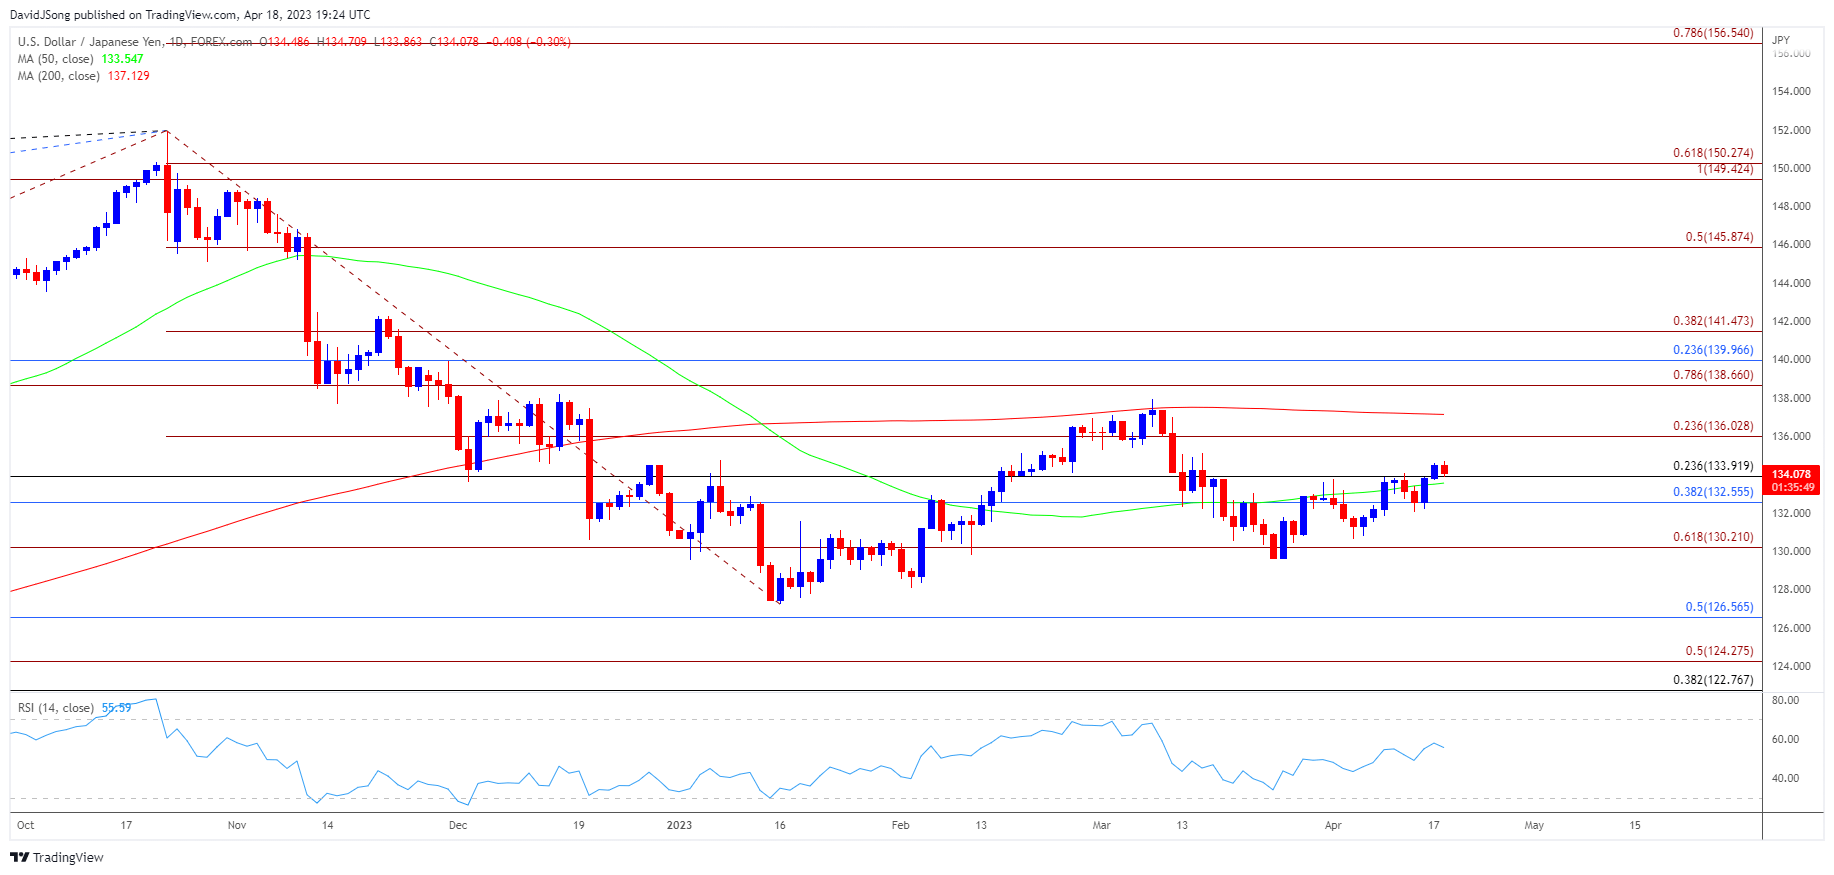
USD/JPY trades to a fresh monthly high (134.71) as it carves a fresh series of higher highs and lows, and the exchange rate may continue to retrace the decline from the March high (137.91) as it appears to be tracking the positive slope in the 50-Day SMA (133.55).
USD/JPY eyes March high as 50-Day SMA establishes positive slope
The recent advance in USD/JPY indicates an improvement in risk appetite as it mirrors the rise in US Treasury yields, and the exchange rate may continue to bounce along the moving average amid growing bets for another Federal Reserve rate hike.
Join David Song for the Weekly Fundamental Market Outlook webinar. Register Here

Source: Atlanta Fed
According to the Altanta Fed GDPNow model, the ‘estimate for real GDP growth (seasonally adjusted annual rate) in the first quarter of 2023 is 2.5 percent on April 14, up from 2.2 percent on April 10,’ and little evidence of a looming recession may push the Federal Open Market Committee (FOMC) to implement higher interest rates as inflation remains well above the central bank’s 2% target.
In turn, the diverging paths between the FOMC and Bank of Japan (BoJ) may keep USD/JPY afloat as Governor Kazuo Ueda plans to achieve the ‘2% inflation target by keeping to monetary easing,’ and it seems as though the central bank is in no rush to switch gears as the ‘JGB purchases are managed out of the need of conducting monetary policy with the aim of achieving the 2% price stability target.’

Source: CME
As a result, speculation surrounding the FOMC may continue to sway USD/JPY as the CME FedWatch tool reflects a greater than 80% probability for another 25bp rate hike, and it remains to be seen if Chairman Jerome Powell and Co. will adjust the forward guidance at the next interest rate decision on May 3 as the ‘the staff's projection at the time of the March meeting included a mild recession starting later this year, with a recovery over the subsequent two years.’
Until then, the Greenback may continue to appreciate against the Japanese Yen as the FOMC keeps the door open to pursue a more restrictive policy, and a further rise in US yields may keep USD/JPY afloat as the BoJ sticks to the Quantitative and Qualitatinve Easing (QQE) program with Yield Curve Control (YCC).
With that said, USD/JPY may track the positive slope in the 50-Day SMA (133.55) amid expectations for anorther 25bp Fed rate hike, and the exchange rate may continue to retrace the decline from the March high (137.91) as it carves a series of higher highs and lows.
Japanese Yen Price Chart – USD/JPY Daily

Chart Prepared by David Song, Strategist; USD/JPY on TradingView
- USD/JPY registers a fresh monthly high (134.71) as it carves a series of higher highs and lows, and the exchange rate may track the positive slope in the 50-Day SMA (133.55) as it trades back above the moving average.
- A break/close above the 136.00 (23.6% Fibonacci extension) handle may push USD/JPY towards the 200-Day SMA (137.13), with a move above the moving average raising the scope for a test of the March high (137.91).
- However, failure to break/close above the 136.00 (23.6% Fibonacci extension) handle may push USD/JPY back towards the 132.60 (38.2% Fibonacci retracement) to 133.90 (23.6% Fibonacci retracement) region, with a break below the monthly low (130.63) opening up the 130.20 (61.8% Fibonacci extension) area.
Additional Resources:
EUR/USD forecast: April 2022 high offers resistance
GBP/USD rally halted ahead of June 2022 high
--- Written by David Song, Strategist


