
USD/JPY, Yen Talking Points:
- It’s been a volatile week for USD/JPY, with the BoJ rate hike ahead of the FOMC meeting which propelled USD/JPY below the 150.00 level.
- While rollover remains tilted to the long side of the pair, given the BoJ’s hike and possible warning of more with the Fed opening the door to cuts, there could remain additional pressure on carry unwind themes. The big question is how the USD/JPY pair will react upon tests of lower-high resistance – whether bulls jump in to drive breakouts or whether longer-term longs use the bump to sell after a bounce.
- While USD/JPY has held a trendline for support, declines have been heavier in EUR/JPY, GBP/JPY and AUD/JPY, each looked at below.
- If you’d like to learn more about trading, I created the Trader’s Course, with six sections and more than seven hours of content. The first three installments are completely open and available: To learn more, the following link will explain further - The Trader’s Course
Well, first things first, as I will try to offer some type of answer to the question that’s the headline of this article: The carry trade does not look very attractive right now, but it’s still early, and it may not yet be finished. And I don’t think anyone in the world knows if we’re on the cusp of greater carry unwind, and that very uncertainty may play a role in what’s going to happen next. I’ll try to explain further below.
First, the chart with current structure as the trendline connecting March 2022 and 2023 swing lows has come back into play this morning.
USD/JPY Daily Price Chart
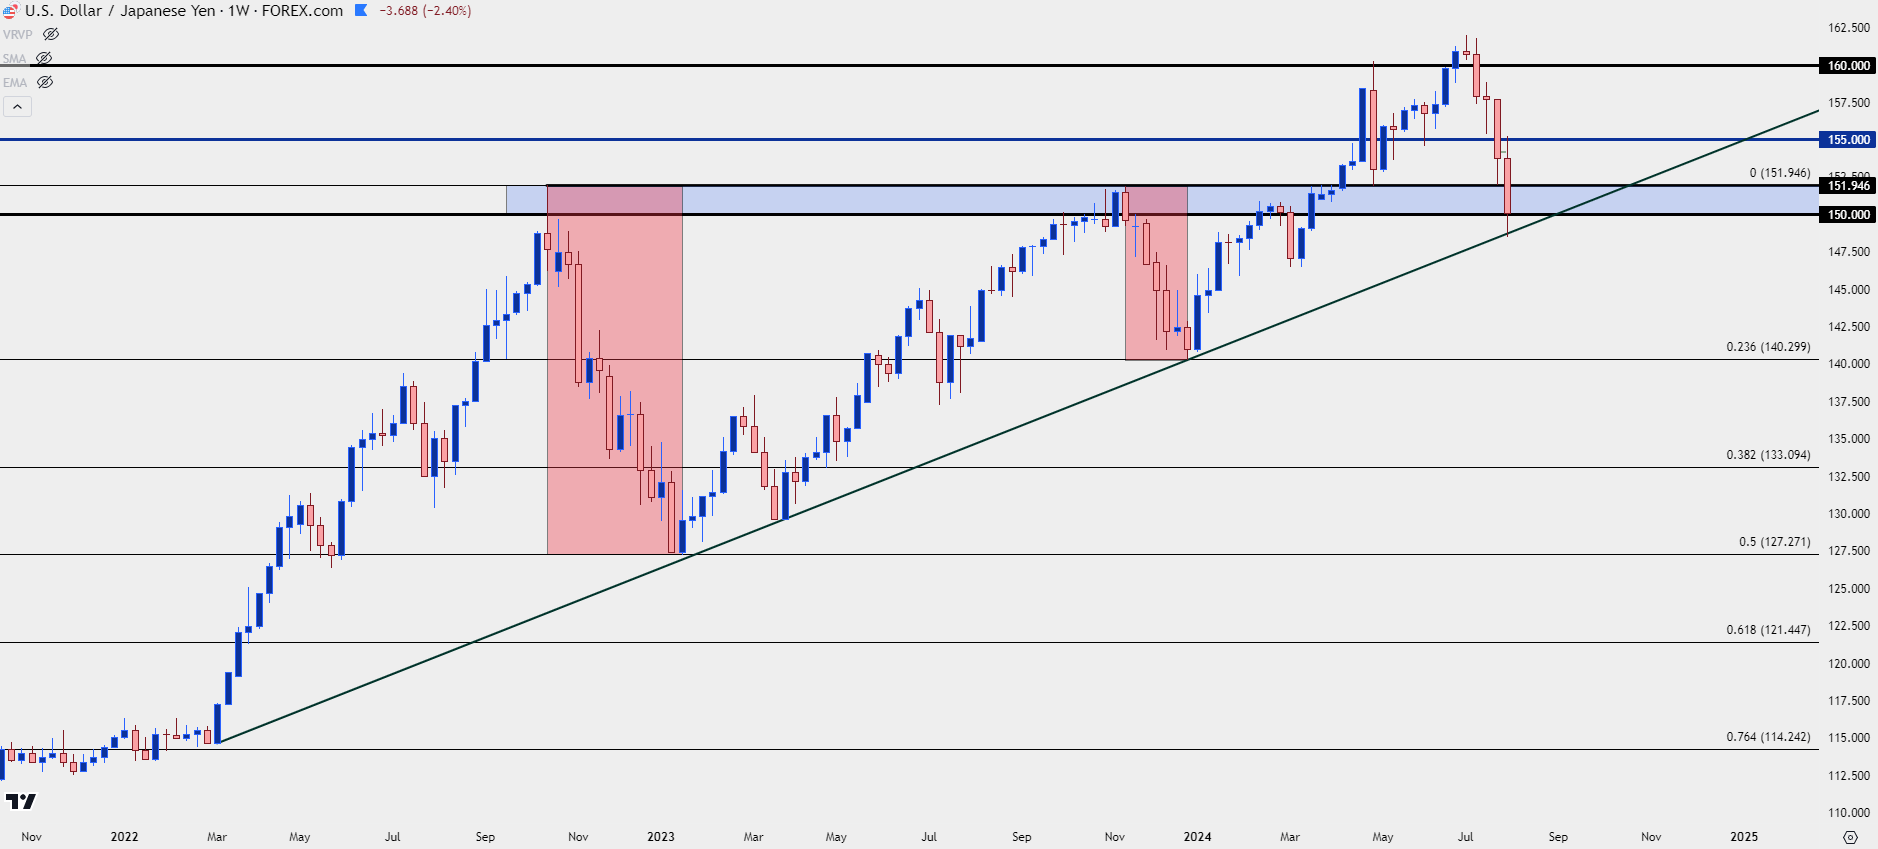 Chart prepared by James Stanley, USD/JPY on Tradingview
Fundamentals have certainly tilted towards unwind themes, as the Bank of Japan hiking rates after multiple interventions designed to support the Yen have combined with rate cut hopes in the US; both factors that could make the rate differential between the economies slighter, thereby removing some of the motivation on the long side of the pair.
But, perhaps more importantly, it’s a sentiment matter and what we’ve seen over the past few weeks speaks to that. As we came into July there remained a wide difference between US and Japanese rates, leading to positive rollover on the long side of the pair and negative rollover on the short side of the pair. This wasn’t a new thing as the carry trade in USD/JPY has been going since early-2021, before the Fed ever hiked rates but driven by the expectation for such as US inflation had already started to climb. That led to a crowded trade and a fairly one-sided trend.
And when a crowded trade gets a whiff that change may be in the air, that can compel longs to close, leading to supply and lower prices. And then as prices head lower, other longs get concerned of watching unrealized gains go up in smoke so they too look to close positions.
This helps to explain the pullbacks in Q4 each of the past two years but, in both cases, the rate relationship between the US and Japan remained roughly the same. Now, that’s shifting, and any shows of support over the past couple of weeks have been mere bounces up to lower-highs only for sellers to hit it harder again.
USD/JPY Daily Price Chart
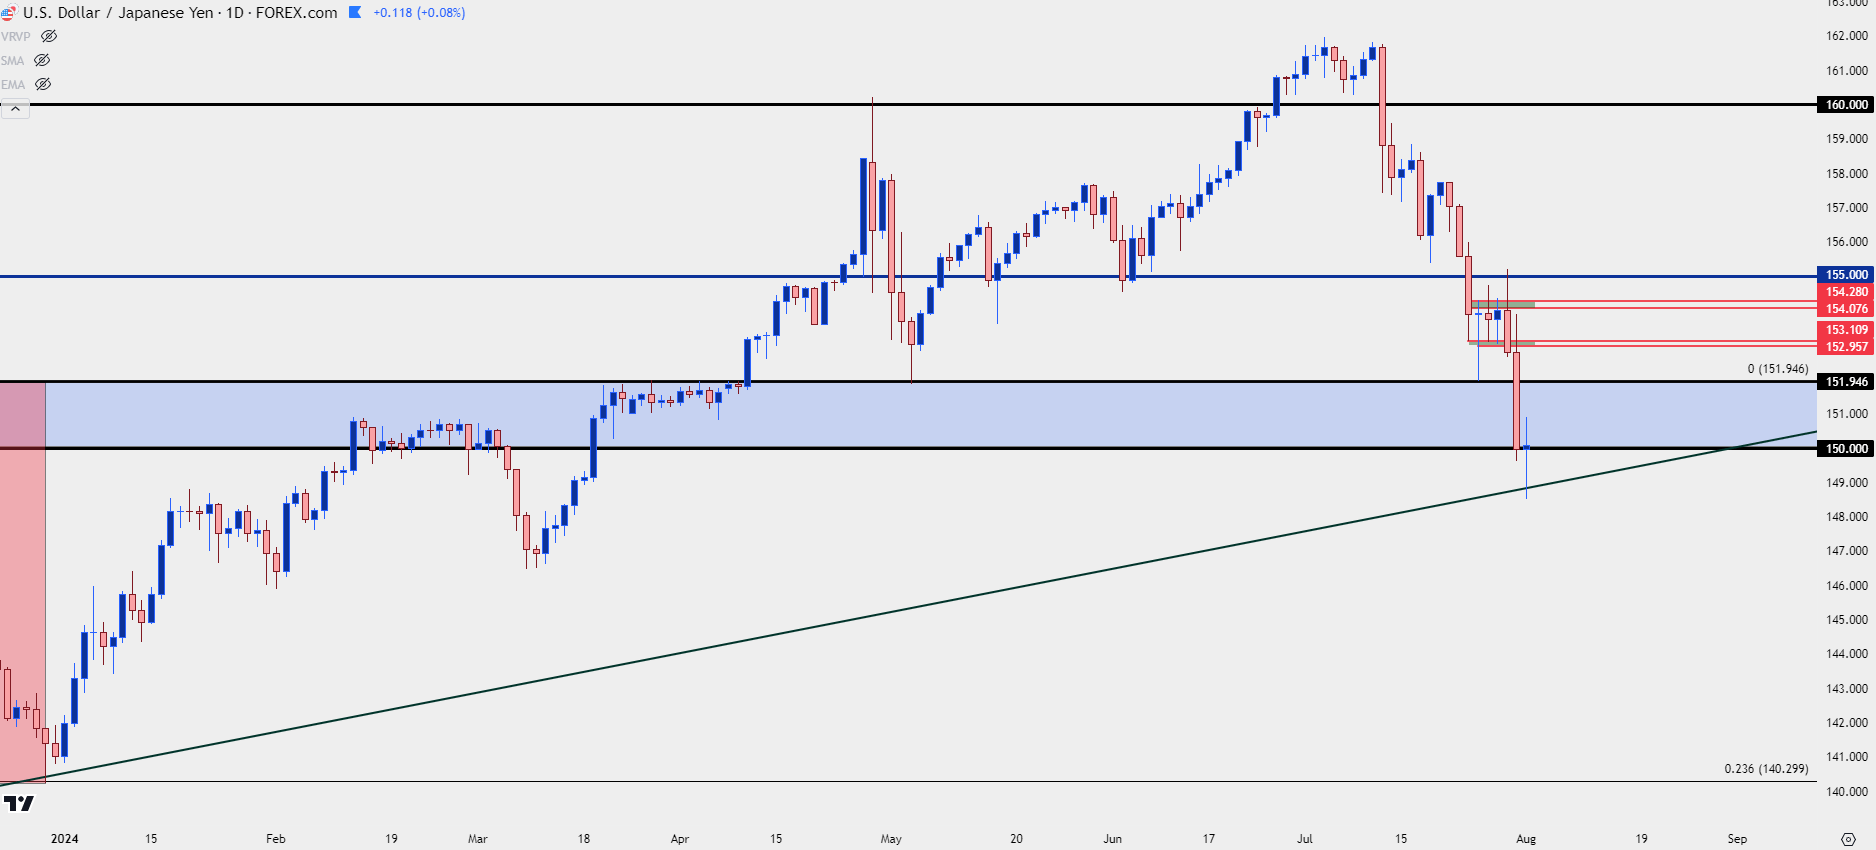 Chart prepared by James Stanley, USD/JPY on Tradingview
At this point, USD/JPY has already taken out a significant amount of that prior bullish structure.
The 155.00 level has so far marked the high over the past week and this highlights one of the scenarios touched on a moment ago: After price tested that level, sellers took over, and this could be a combination of longs closing positions and shorts taking on fresh exposure, but that’s the recipe for building continued lower-highs.
With the test below 150.00, there was an open door for bulls to come back in as the pair could be perceived as relatively ‘cheap’ given recent dynamics, combined with a test below the 200-day moving average and oversold RSI readings on the daily chart of USD/JPY. That couldn’t stop the bleeding and buills couldn’t make a push until the trendline came into play.
So, this is still a dicey situation. From the four-hour chart below we can see where buyers appear to be showing support at the 150.00 psychological level after the bounce earlier this morning. And holding that will be key for buyers if they do want to stage a deeper push.
It’s after that deeper push, if it does happen, that we can gain more information; key of which is whether sellers use 152.00 in a similar manner that they did 155.00 last week. If they do, then we’ll have greater evidence of more carry unwind which keeps bears in order to push down to a fresh lower-low.
The matter does seem less contentious elsewhere, however, as I’ll look at after the next chart.
USD/JPY Four-Hour Price Chart
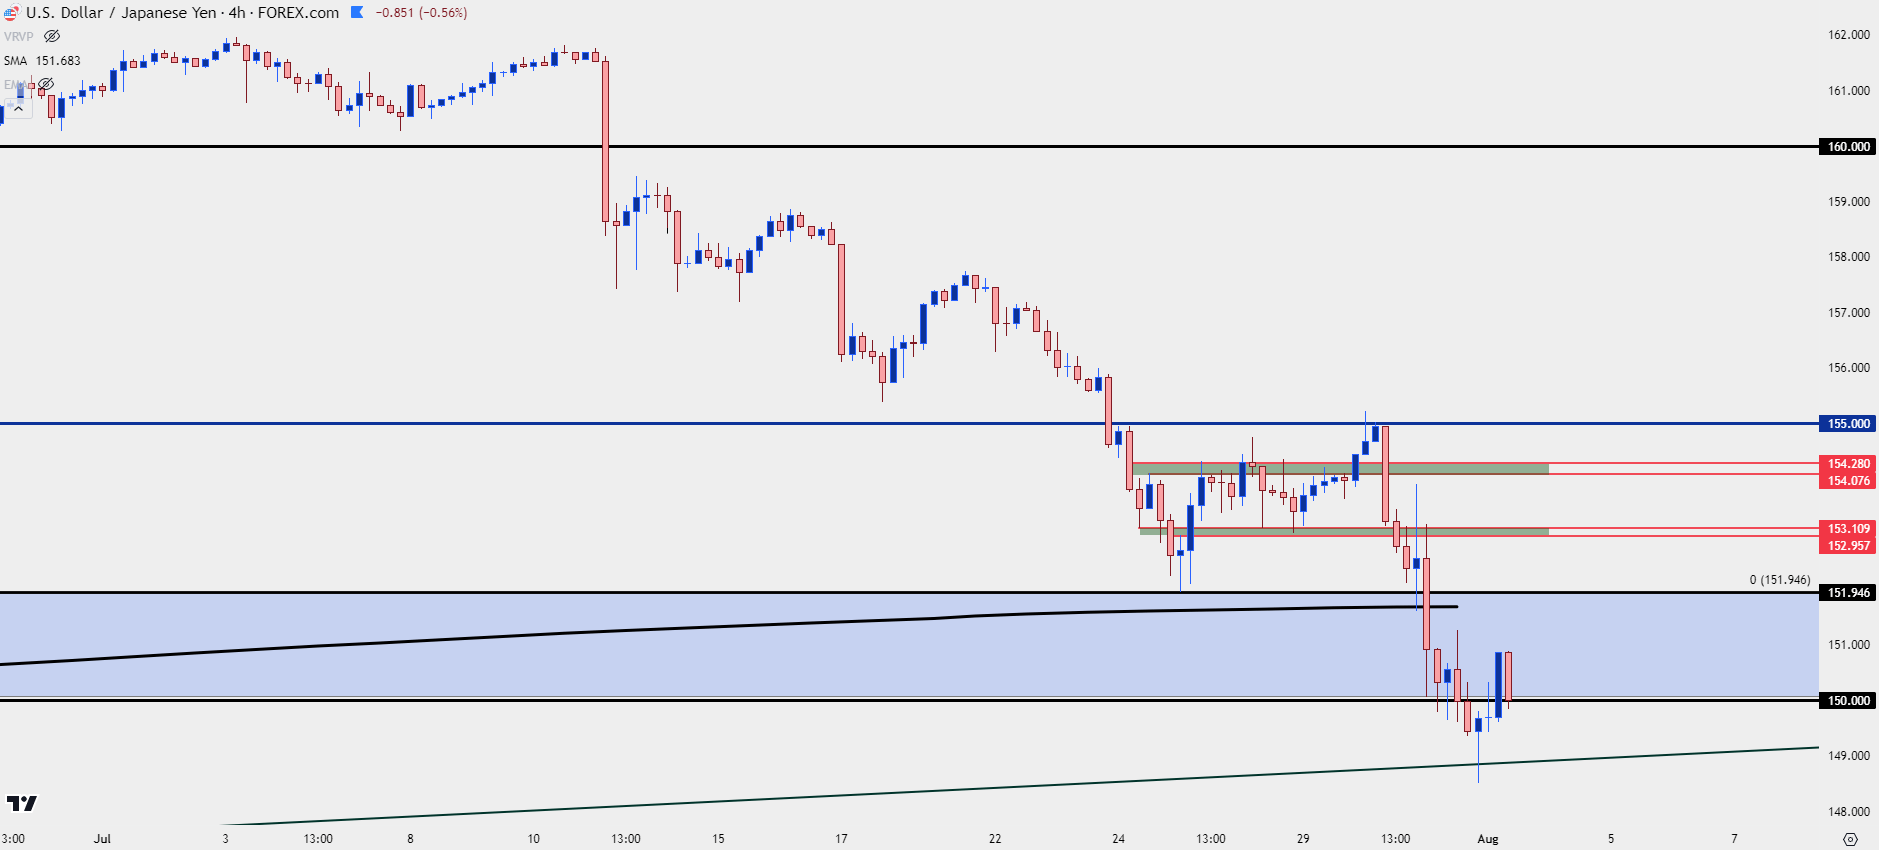 Chart prepared by James Stanley, USD/JPY on Tradingview
EUR/JPY
While the debate rages on around US rate hikes, the matter is a bit more clear in Europe where the ECB has already cut rates. And thus, there’s even less argument on the long side of the carry trade than there is in the above major of USD/JPY.
Yesterday marked the first daily close below the 200-day moving average since March of 2023, and there’s already been a breach of a rising wedge formation, often approached with aim of bearish reversals, which has started to set-in.
At this point, support has shown at the 61.8% Fibonacci retracement of the 2023-2024 major move, with the 160.00 level just below that. Bounces could attract more bearish behavior, both from sellers taking on exposure and longs looking to get out before a steeper decline. There’s resistance potential at the 200-day moving average, as well as the 165 area of prior support sitting overhead.
EUR/JPY Daily Price Chart
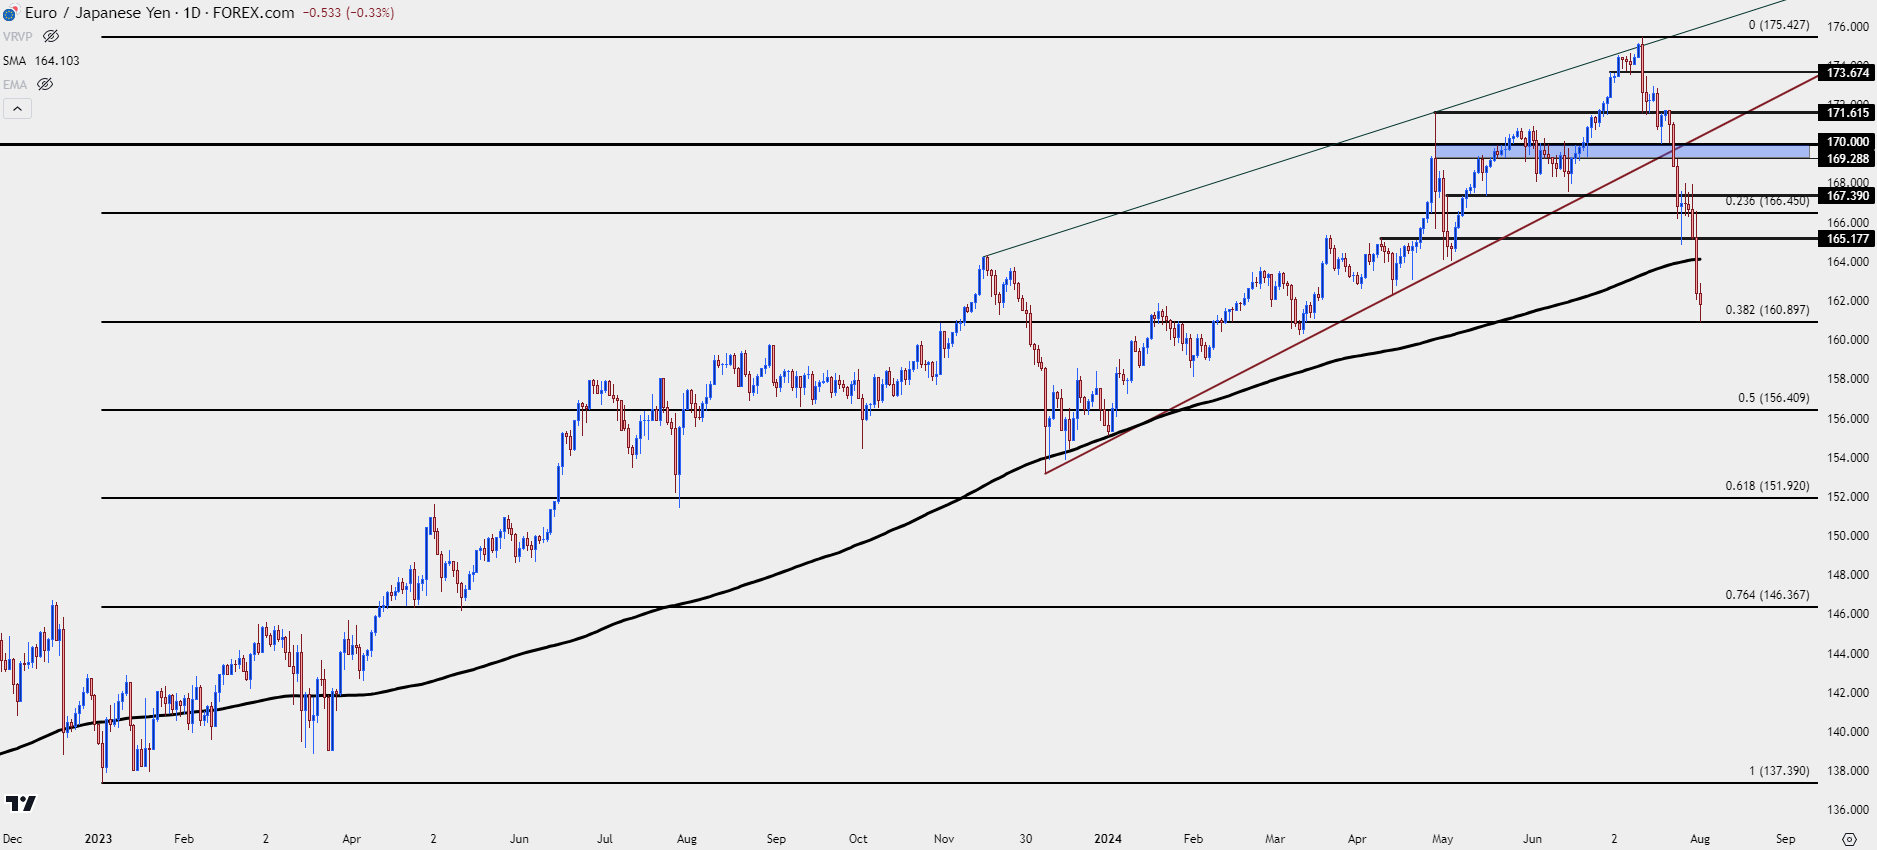 Chart prepared by James Stanley, EUR/JPY on Tradingview
GBP/JPY
The Bank of England joined the rate cutting fray earlier this morning with their first rate cut since the pandemic. Similarly, this removes some of the motivation on the long side of the carry as rate differentials have narrowed between the U.K. and Japan.
GBP/JPY has already come off aggressively, however, falling by more than 1,700 pips since the BoJ intervention on July 11th. At this point, RSI on the daily is in deeply oversold territory (sub-20, as of this writing) while pushing below the 200-day moving average.
Given that backdrop, chasing could be dangerous but the larger test is whether sellers can hold lower high resistance at prior support, such as the 193.61 level, or perhaps even the 195.00 handle if a pullback can show.
GBP/JPY Daily Price Chart
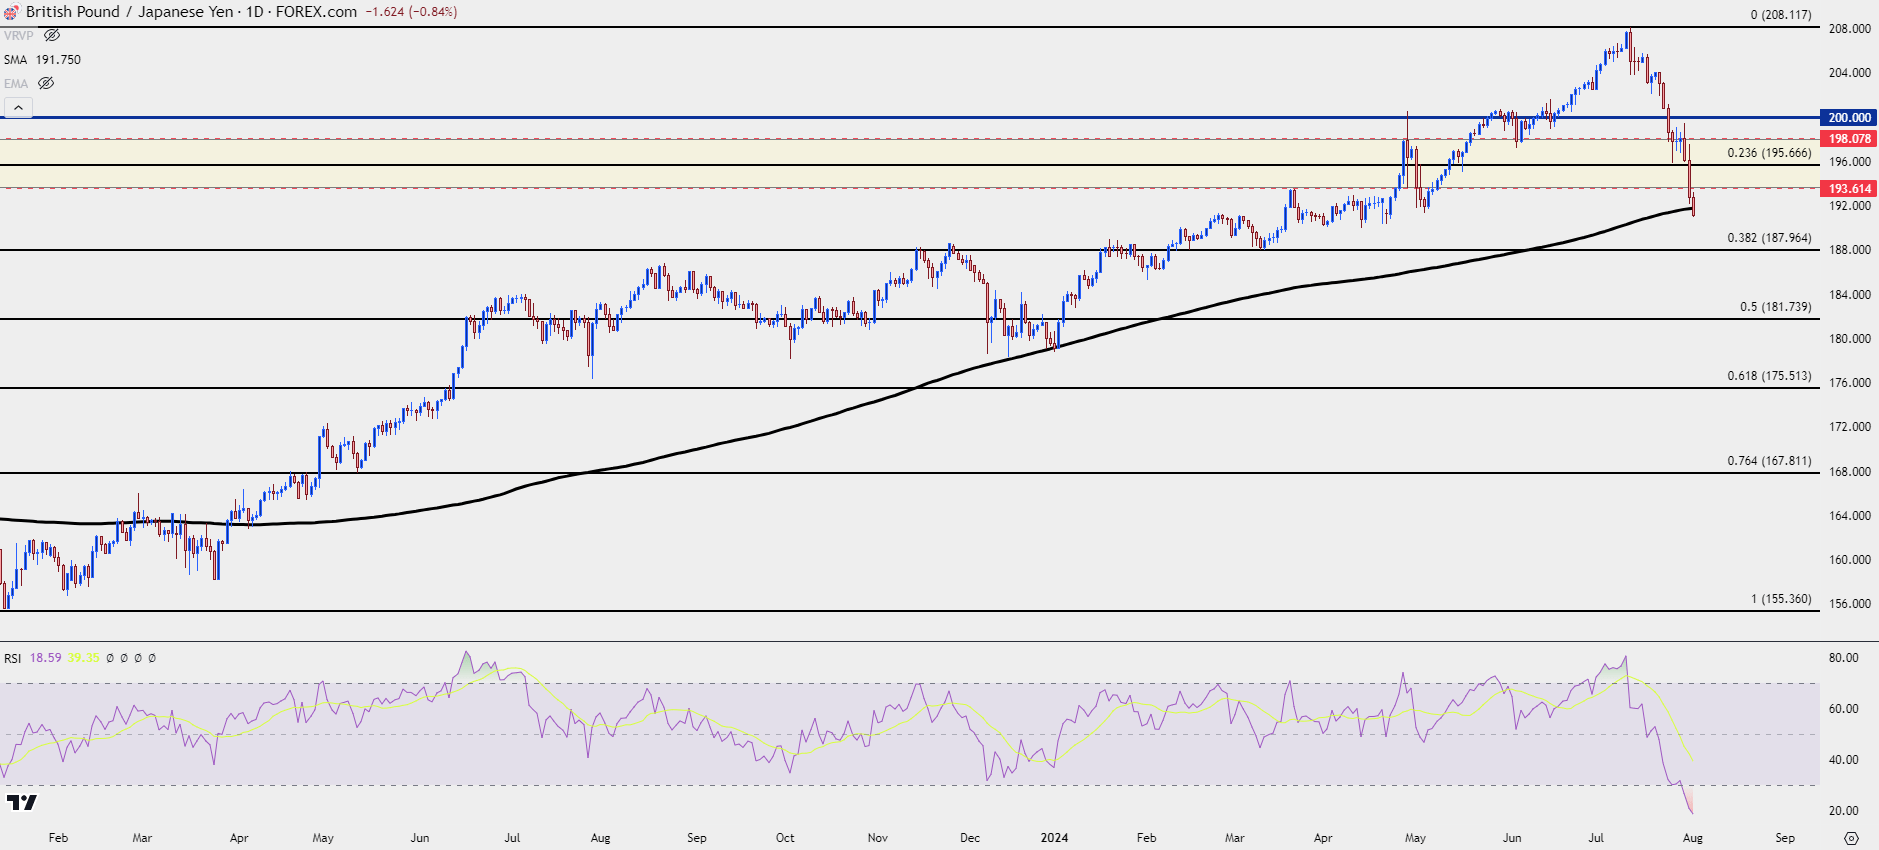 Chart prepared by James Stanley, GBP/JPY on Tradingview
AUD/JPY
AUD/JPY has moved from an extreme overbought read on RSI from the daily (above 80) to extreme oversold (sub-20) in just a few short weeks. There’s some support structure that’s already started to come into play at 97.70, which is the 23.6% retracement of the 2020-2024 major move.
This can make the prospect of chasing the pair lower as a bit more daunting but, similarly, the big test is what happens at a lower-high: Whether bulls use that to take off risk following a bounce, fearful of another leg lower, or whether buyers drive a breakout as driven by the still-positive carry on the long side of the pair.
The big spot for that appears to be around the 100.00 psychological level and with a price that clearly oriented on the chart, expect some second-order dynamics; as in, getting closer to 100.00 could compel bears to enter earlier so, ideally, a lower-high would print before a test right at the big figure for those looking for the bearish scenario to play out.
AUD/JPY Daily Price Chart
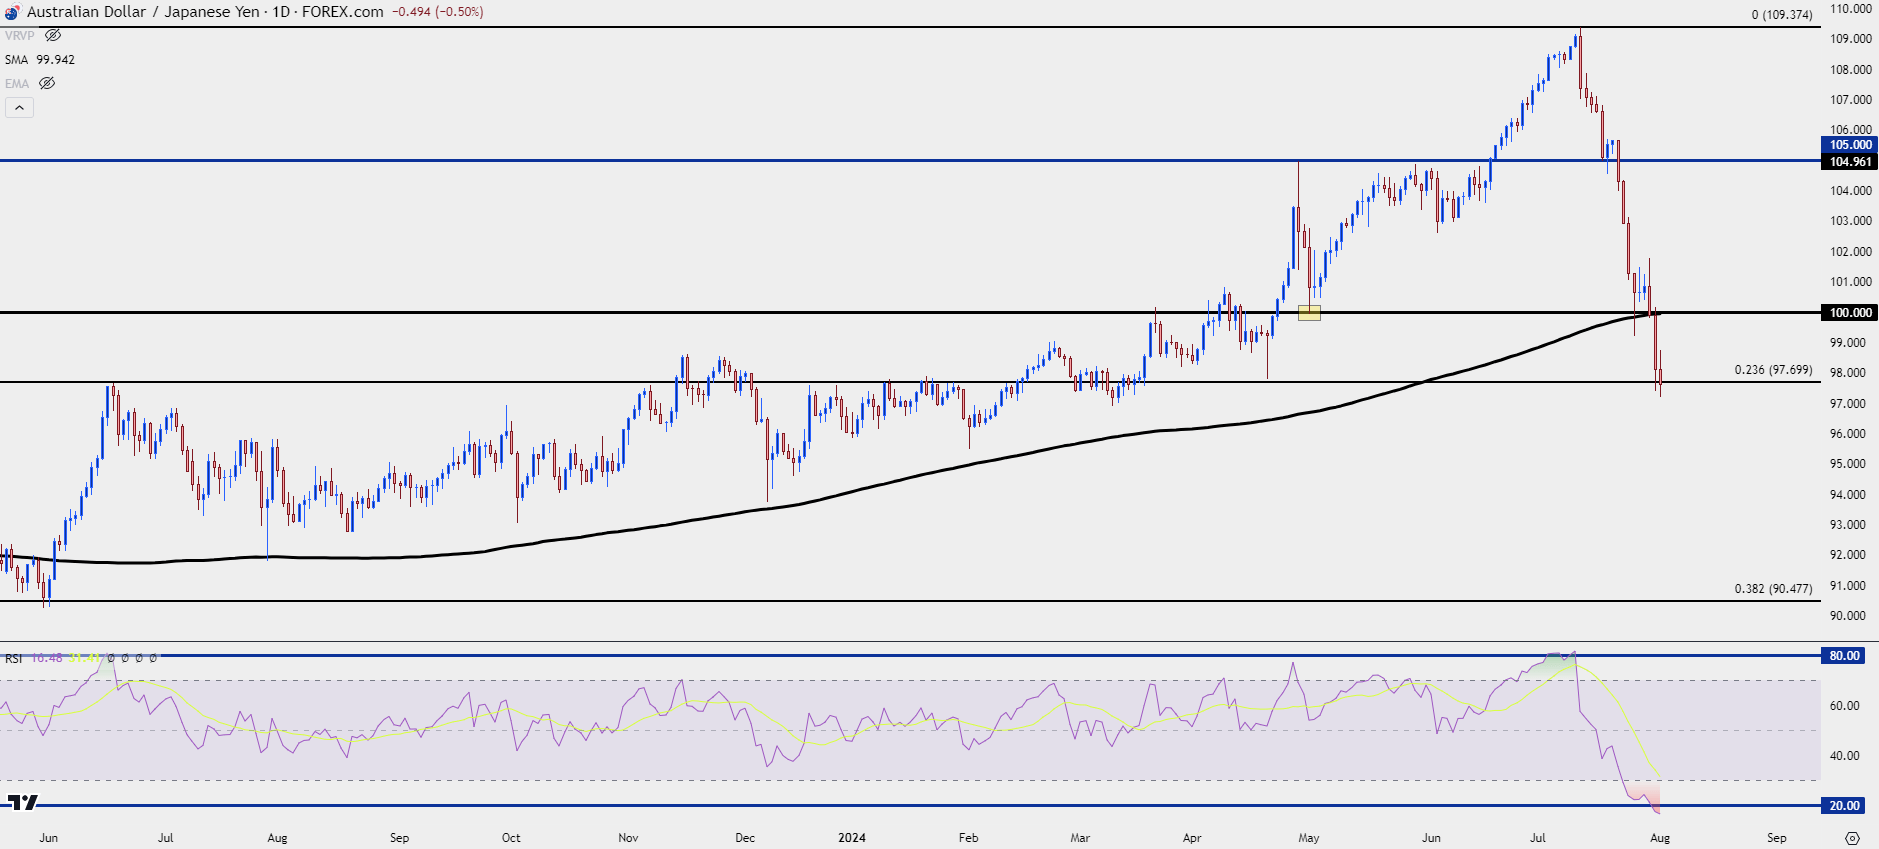 Chart prepared by James Stanley, AUD/JPY on Tradingview
--- written by James Stanley, Senior Strategist


