US Dollar Outlook: USD/JPY
USD/JPY carves a series of higher highs and lows as it stages a four-day rally, and the exchange rate appears to be on track to test the yearly high (145.07) as it clears the opening range for August.
USD/JPY Breaks Above Monthly Opening Range to Eye Yearly High
USD/JPY registers a fresh monthly high (144.90) as the US Produce Price Index (PPI) shows a 0.8% rise in July versus forecasts for a 0.7% print, and data prints coming out of the US may continue to sway the exchange rate as the Bank of Japan (BoJ) sticks to Quantitative and Qualitative Easing (QQE) with Yield-Curve Control (YCC).
Join David Song for the Weekly Fundamental Market Outlook webinar. David provides a market overview and takes questions in real-time. Register Here
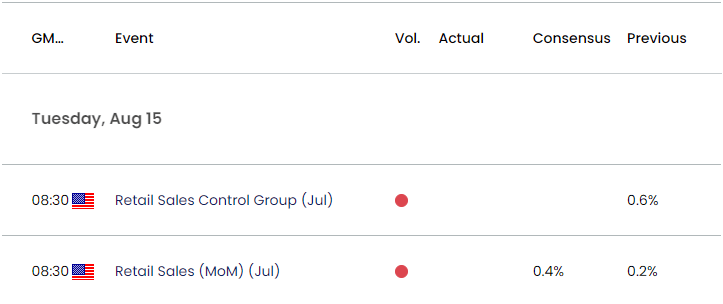
US Economic Calendar

As a result, the update to the US Retail Sales report may keep USD/JPY afloat as household spending is expected to increase 0.4% in July following the 0.2% rise the month prior, and a pickup in private-sector consumption may push the Federal Reserve to further combat inflation as the economy shows little signs of a looming recession.

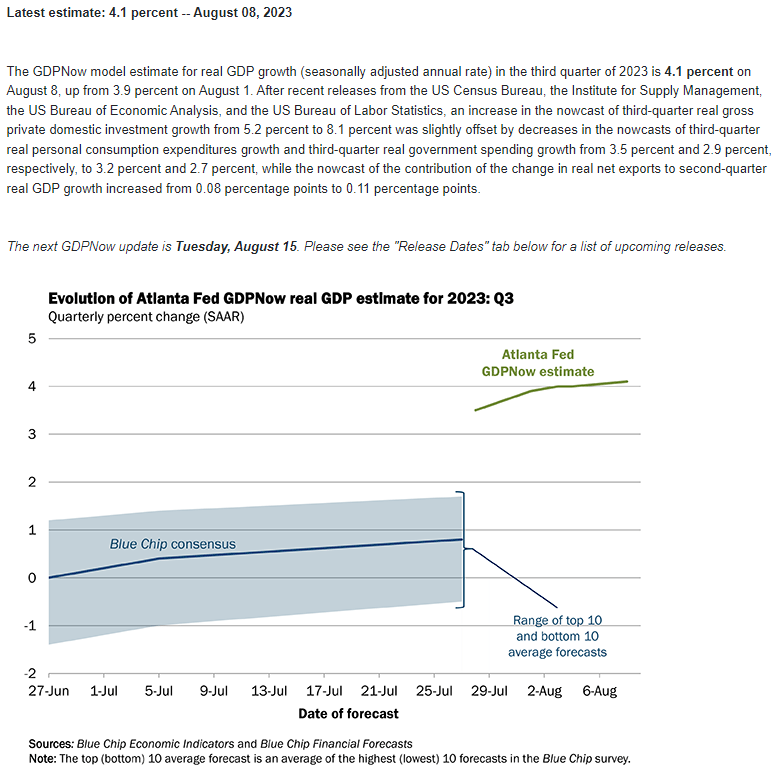
Source: Atlanta Fed
In turn, the next update to the Atlanta Fed GDP Now model may show another upward revision as the ‘estimate for real GDP growth (seasonally adjusted annual rate) in the third quarter of 2023 is 4.1 percent on August 8, up from 3.9 percent on August 1,’ but a weaker-than-expected US Retail Sales report may produce headwinds for the Greenback as it puts pressure on the Federal Open Market Committee (FOMC) to conclude its hiking-cycle.
With that said, data prints coming out of the US may continue to sway USD/JPY as the FOMC keeps the door open to pursue a more restrictive policy, but the break above the monthly opening range may lead to test of the yearly high (145.07) as the exchange rate carves a series of higher highs and lows.
USD/JPY Price Chart – Daily

Chart Prepared by David Song, Strategist; USD/JPY on TradingView
- USD/JPY appears to have reversed ahead of the 50-Day SMA (141.70) as it carves a series of higher highs and lows, and the exchange rate may track the positive slope in the moving average as it approaches the yearly high (145.07).
- A break/close above the 145.90 (50% Fibonacci extension) to 146.70 (78.6% Fibonacci retracement) region may push USD/JPY towards the November 2022 high (148.83), with the next area of interest coming in around 149.40 (100% Fibonacci extension) to 150.30 (61.8% Fibonacci extension).
- However, failure to break/close above the 145.90 (50% Fibonacci extension) to 146.70 (78.6% Fibonacci retracement) region may push USD/JPY back towards the moving average as the Relative Strength Index (RSI) remains well below overbought territory.
Additional Market Outlooks:
US Dollar Forecast: EUR/USD Clears August Opening Range
GBP/USD Susceptible to Break of August Opening Range
--- Written by David Song, Strategist
Follow on Twitter at @DavidJSong


