
U.S. Dollar, USD/JPY, EUR/USD Talking Points:
- It’s a big week for global markets with several rate decisions and key data releases, headlined by the Bank of Japan rate decision later tonight and the FOMC rate decision on Wednesday.
- There’s been percolating rumor of a possible rate hike out of Japan and that could create quite a bit of reverberation given how built-in the carry trade has become over the past few years. And questions remain around FOMC policy as U.S. data has remained somewhat strong from a few different vantage points, bringing questions around the Fed’s rate cut plans for later this year. With little expectation for any actual rate adjustments, the focus on Wednesday’s meeting will likely be centered on the SEP (Summary of Economic Projections).
- I’ll be discussing these themes in-depth in the weekly webinar. It’s free for all to register: Click here to register.
It's a big week for global markets and this is something that could bring impact to equities, commodities, and the FX market. The BoJ rate decision later tonight looks to be especially interesting, perhaps one of the more interesting in years as there’s been recent thoughts that the Bank of Japan may exit their negative rate regime.
With the Bank of Japan still sticking with negative rates, that’s allowed for carry trades to build over the past few years and that rate divergence was a key driver trends in USD/JPY, EUR/JPY, GBP/JPY amongst other Yen-pairs. As I looked at last week, there’s question marks on the timing given that the Japanese economy has narrowly avoided recession and inflation has been working-lower even without any action from the BoJ over the past six months.
On the other side of the argument, and something looked at by Matt Weller in this week’s Forecast for JPY, is the fact that wage growth pressures are creating a big of angst as Japan’s largest trade union has seen a 5.3% increase in wages compared to 3.8% the year before.
So, if the BoJ does make a move here it would seem that it’s largely brought on by the fear of what may happen as wage growth has ticked-higher, as opposed to what’s been happening with inflation softening over the past six months.
And, like I said in that prior article, I have no idea whether the BoJ will force this move right now, and I don’t think anyone else outside of the BoJ or perhaps the Japanese Finance Ministry knows either. It doesn’t seem to make sense given the timing with how data has been shaping of late; but the BoJ has been using highly-unorthodox policy already by not having adjusted rates and staying heavy with their YCC policy since even before the pandemic. One possibility is that those wide-ranging media reports were a probe from the BoJ, leaked to gauge tolerance for such a move. In which case, tonight’s rate decision could be a furtherance of that theme with the Bank beginning to open the door to tighter policy in the coming months.
But, like we saw in Q4 each of the past two years, with crowded carry trades prices can revert very quickly. And the very act of JPY finding strength could further hit inflation as a strong currency for an import-heavy economy can further erode inflationary pressure. This would seem a big risk and the BoJ is traditionally a somewhat conservative Central Bank.
Interestingly, since those reports of a possible rate hike started hitting the wires last week, JPY weakness has returned, and USD/JPY is now working on its fifth consecutive daily gain after finding support and completing a morning star formation last Monday. The lead-in to that, however, was a bearish show as USD/JPY had fallen below a rising wedge formation as I had looked at a couple of weeks ago.
At this point, the pair is holding resistance in that same zone that I had looked at in last Thursday’s article. And just overhead is the 150.00 level that remains of interest.
USD/JPY Daily Price Chart
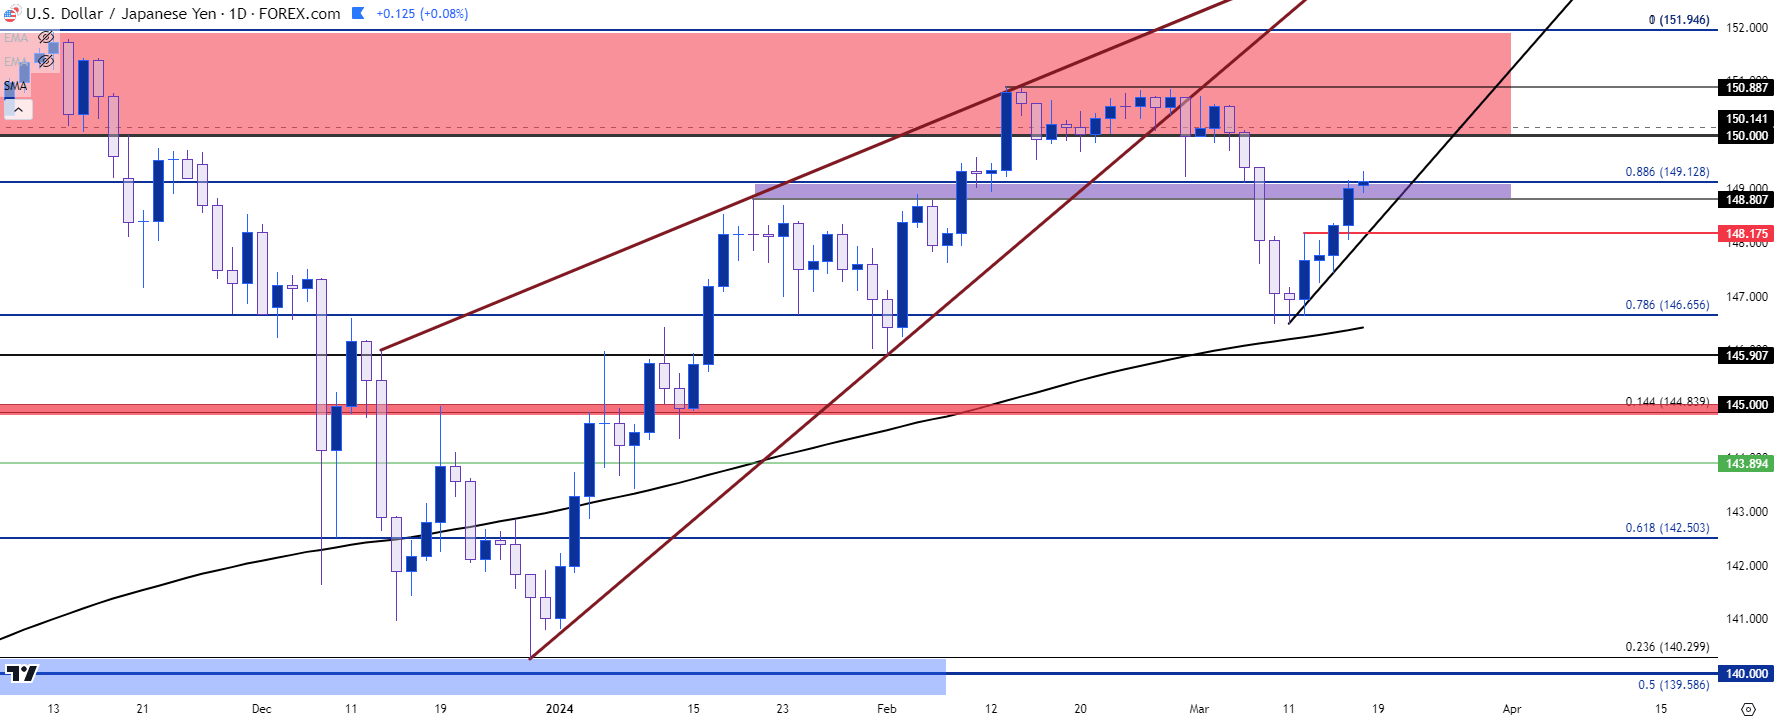 Chart prepared by James Stanley, USD/JPY on Tradingview
USD/JPY Longer-Term
Taking a step back to the weekly highlights the importance of resistance at the 150-152.00 area. This has been defended multiple times by Japanese government officials, from the intervention in Q4 of 2022 to the threats for the same just last month. So that provides a line in the sand, to a degree; and as I’ve been saying of late, USD/JPY could remain an attractive venue for scenarios of USD-weakness. That was what helped to produce the 2,472 pip pullback that started in October of 2022, along with the 1,000+ pip pullback from November of 2023.
If JPY-strength is in the mix on the back of a rate hike from the BoJ, that could further make USD/JPY an attractive venue for USD-weakness scenarios as we approach the FOMC.
USD/JPY Weekly Price Chart
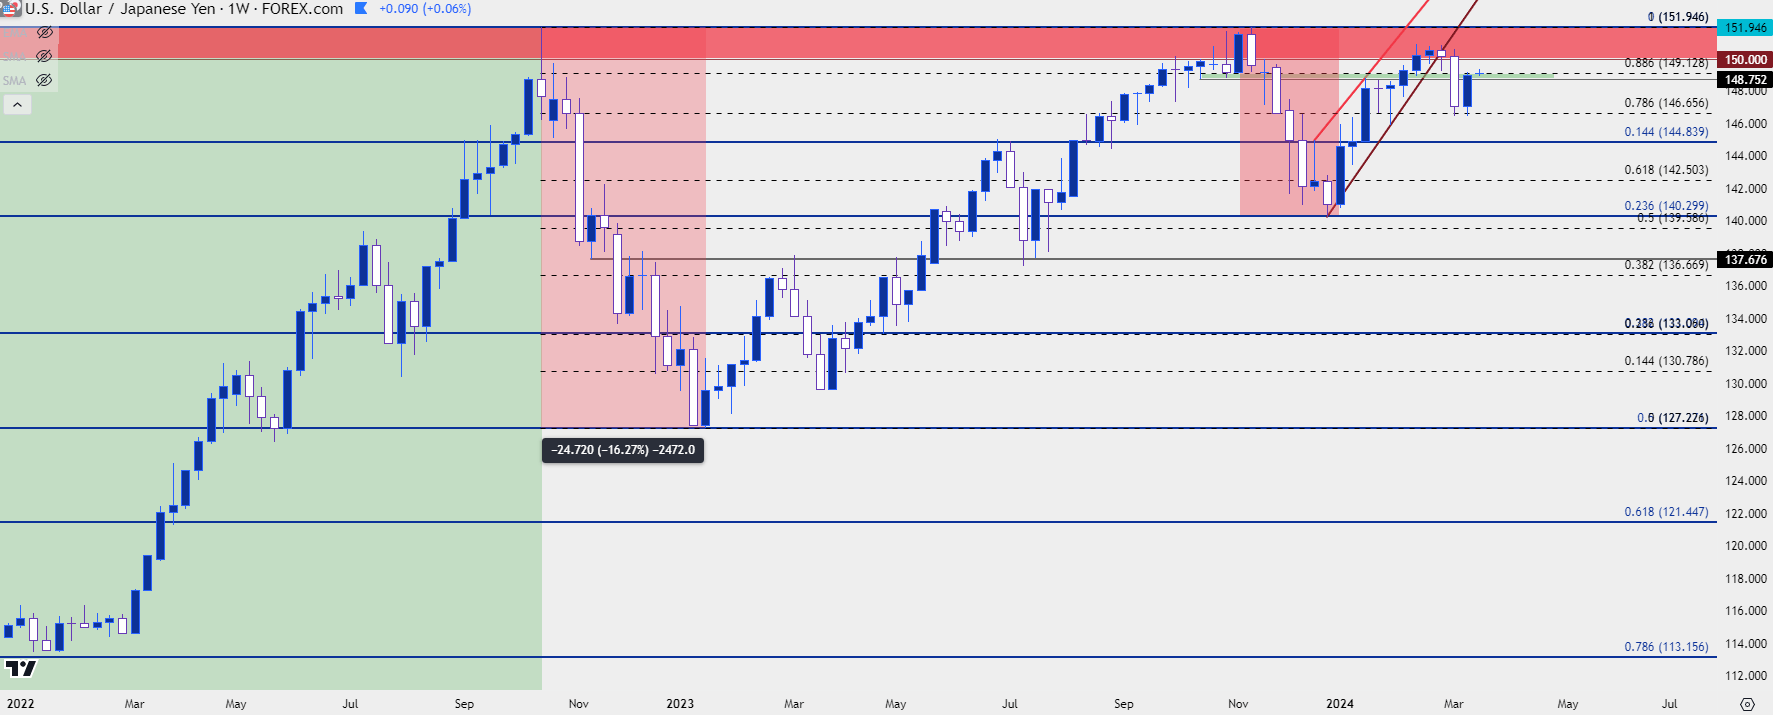 Chart prepared by James Stanley, USD/JPY on Tradingview
USD into FOMC
There’s little expectation for any actual changes to rates at Wednesday’s meeting but, as has become the norm, the focus will be on the Fed’s projections with aim of deciphering expectations for the rest of the year. Of late, there’s been sliding expectations for even a rate cut in June, and that would further bring to question the three rate cuts that the Fed had talked about in their last Summary of Economic Projections that was released in December.
The case for rate cuts isn’t that great if looking at the Fed’s dual mandate of employment and inflation. As seen in the most recent NFP report, the labor market in the U.S. remains relatively strong from those data points. And from inflation as we saw last week for CPI, Core inflation remains sticky and elevated well-beyond the Fed’s 2% target. If we look at other inflation data points, however, that case for rate cuts could get a bit of life as Core PCE has continued to fall rather quickly over the past six months, even as Core CPI has been sticky around the 4% marker.
U.S. Inflation: Core CPI (blue) v/s Core PCE (orange)
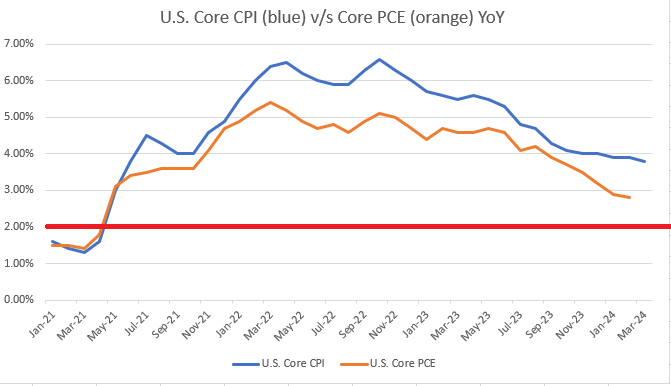
Chart prepared by James Stanley
USD Themes
The U.S. Dollar was beaten down in Q4 of last year, specifically from the November 1st rate decision into the December 28th low. The Fed sounded very dovish in early-November and the market started to whittle away expectations for any additional hikes. That theme caught a shot-in-the-arm with the CPI report released in November, which helped to push breaks in USD/JPY and Gold, and the Fed again sounded very dovish at the December rate decision.
But, as we came into the New Year a new theme had started to show as USD-strength was coming back, at odds with the continuous dovish Fed-speak that was tamping down that bullish trend.
In the first week of the year, DXY found resistance at 102.55 and that held for a couple of weeks before bulls pushed another higher-high into the mix. That resistance set-in around the 200-day moving average which, again, held for a few weeks before bulls forced the trend-higher. That extension was pushed by the NFP report in early-February.
The pullback from that high held at a higher-low, and a couple of weeks later there was another extension in the trend on the back of the February CPI report. USD came very close to the 105.00 level which is a big spot for DXY, as this is a longer-term Fibonacci level that had functioned as resistance-turned-support in late 2023 trade.
But that’s around the time that the dovish comment from Chicago Fed President came into play, further illustrating that dynamic where the ‘natural flow’ of the USD seemed higher; but the dovish FOMC drive helped to tamp that move down. That pushed price back to the 200-day moving average which held support for a couple of weeks before bears were finally able to prod a fresh breakdown.
That breakdown found support at 102.55, the same resistance from the first few weeks of 2024 trade, and prices have been pulling back in the week since. At this point, price is testing resistance at a bearish trendline taken from February and March swing highs, which is nearing confluent with the 200-day moving average.
U.S. Dollar Daily Price Chart
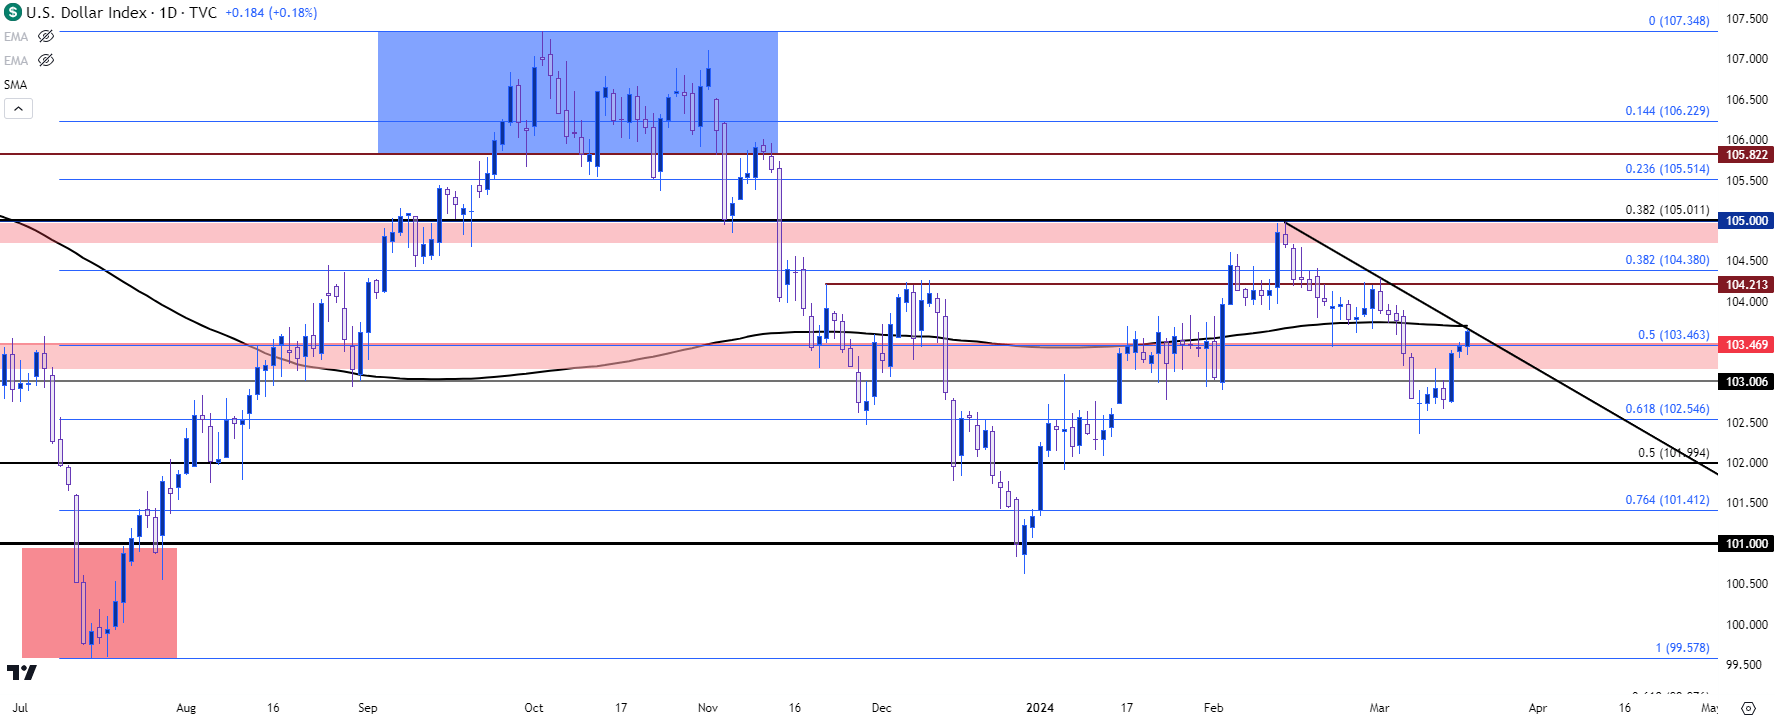 Chart prepared by James Stanley; data derived from Tradingview
USD Trajectory
Given that the DXY is merely a composite of underlying currencies with a heavy 57.6% weighting into the Euro, it’s rationale to look at EUR/USD when investigating the possibility of fresh trends in either market. On a longer-term basis, both markets have been range-bound for the past 15 months so the question here is whether prices will continue to fill-in that range, more so than looking at ‘big picture’ breakouts just yet. I’ve added a bit more time on the below daily chart of DXY to illustrate this mean reversion, and we’re currently near the middle of that range.
If there is breakout beyond the 200-dma, there’s follow-through resistance potential at 104.21, 104.38 and then the zone that rebuked bulls back in February from around 104.78 up to 105.00.
U.S. Dollar Daily Price Chart
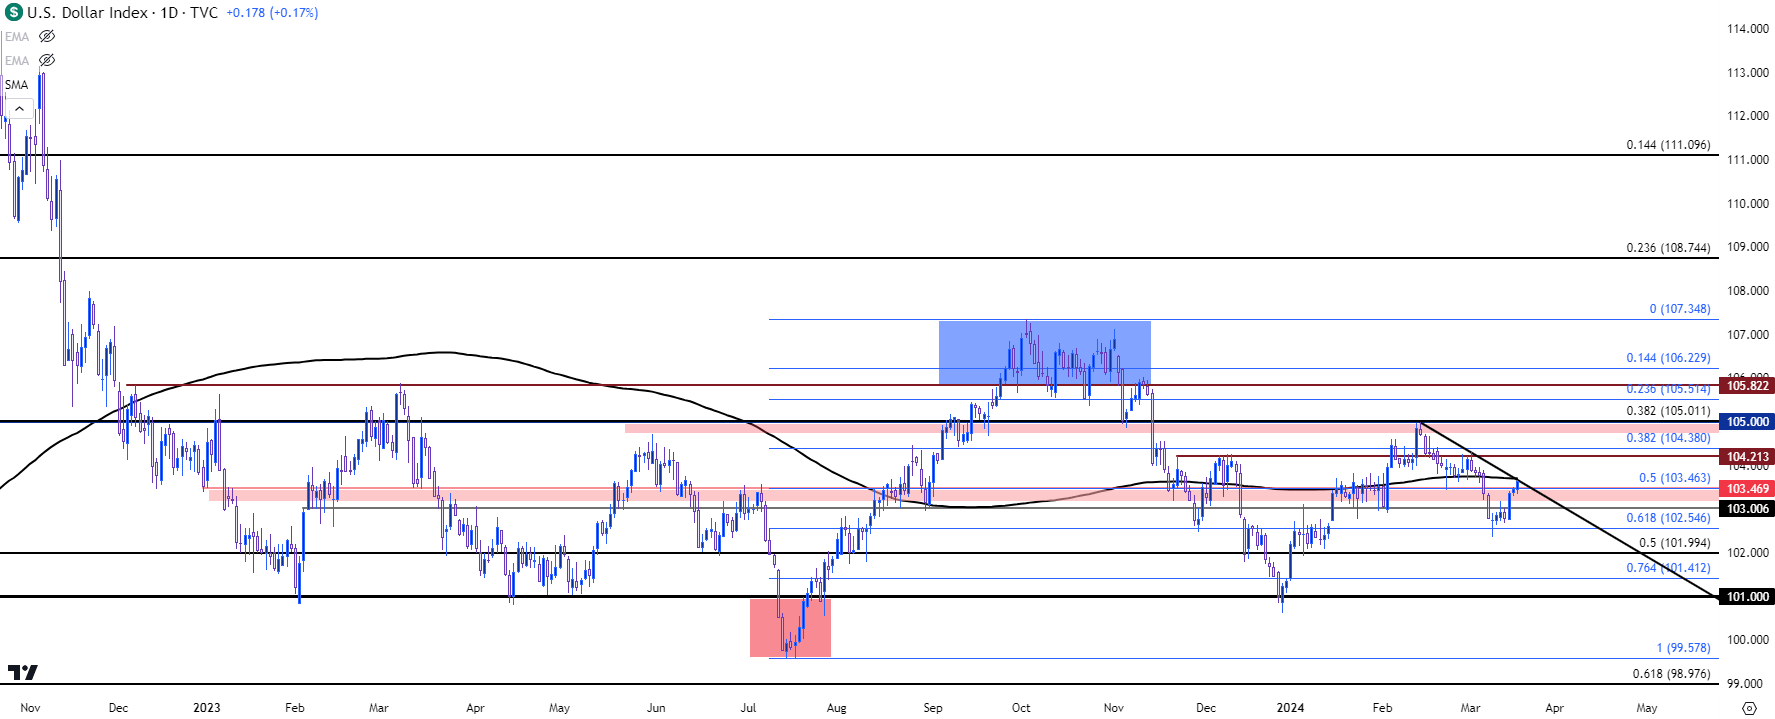 Chart prepared by James Stanley; data derived from Tradingview
EUR/USD
Spanning over to EUR/USD shows a similar range over the past 15 months and we’re also near the middle of that mean reversion here.
Ever since the Austan Goolsbee comment the morning after CPI in February, EUR/USD was trending higher in the form of a bullish trend channel. The bottom of that channel held the lows into the end of last week and so far this morning, bears have been trying to push a break.
There’s more context for support down to the 1.0862 level, after which the 200-day moving average comes back into play. That currently plots around 1.0840 and sellers taking that out would be notable, and this would cast attention to the next support zone plotted around the 1.0750-1.0765 area, followed by the February swing low at 1.0694.
EUR/USD Daily Price Chart
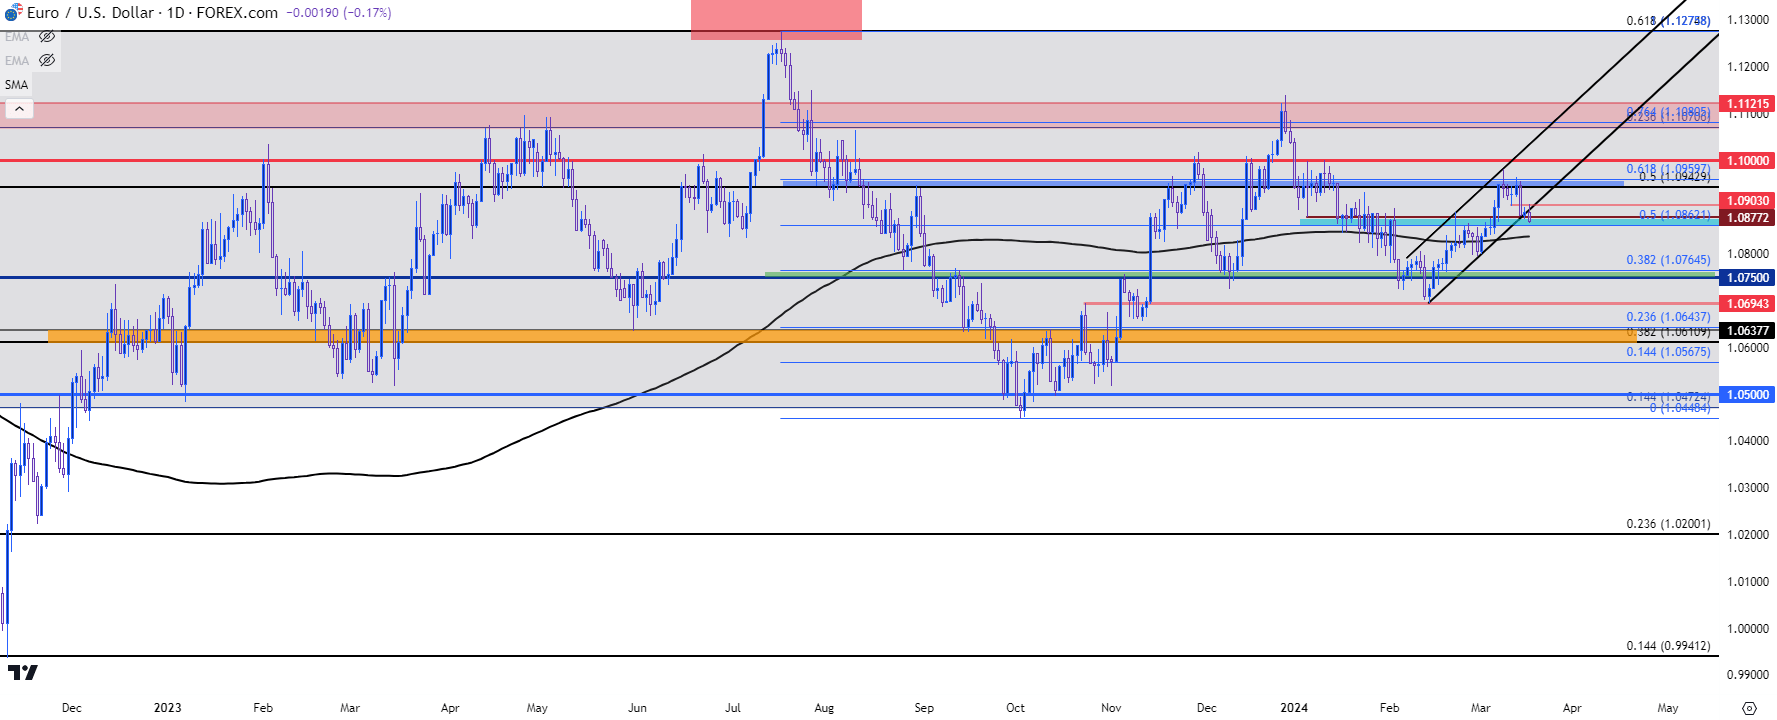 Chart prepared by James Stanley, EUR/USD on Tradingview
--- written by James Stanley, Senior Strategist


